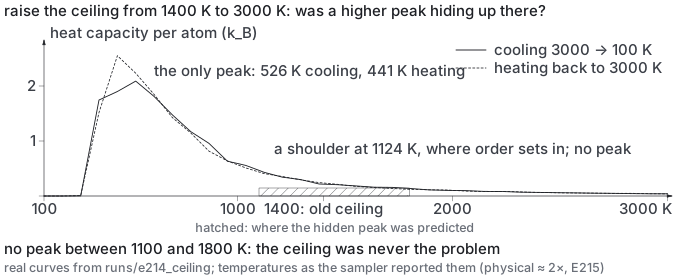
Was a higher-temperature ordering peak hidden above the simulation's old 1400 K ceiling?
No. Swept up to 3000 K, the only peak stayed near 480 K; the ceiling was never the problem.
In the log: pre-registered before it runs (2026-09-21 07:4x)
mixedDate 2026-09-21 07:4x, as written in the logrung 4 · DFT4 predictions · 2 result paragraphsEXPERIMENTS.md lines 13599–13613, lines 13721–13763, lines 13971–14009
What E214 did and how it came out, drawn from this record and the files it names (book/assets/diagrams/exp/E214.svg).
Pre-registration
(1)
A specific-heat peak appears between 1100 and 1800 K
that no 1400 K sweep could show.
falsifiedon both legs …
(2)
The 456 K feature survives as a smaller
second peak — if it vanishes, it was an artefact of the old sweep's hot end rather than a
real low-temperature transition, which is a different finding and a better one.
no verdict written against it
(3)
The
SRO onset stays where E207 put it, 1100–1250 K, because that observable was never censored.
confirmedexactly …
(4)
The high peak lands below the published 2020 K, because v5's ΔE_order (76.5) is
short of the ≈110 meV the mapping needs for 2020 K.
What it settles. If
no verdict written against it
The pre-registration, as written
E214 — pre-registered before it runs (2026-09-21 07:4x)
Mo–Ta, the same cell and statistics as E207, swept 3000 → 100 K and back instead of
1400 → 100. Predictions. (1) A specific-heat peak appears between 1100 and 1800 K
that no 1400 K sweep could show. (2) The 456 K feature survives as a smaller
second peak — if it vanishes, it was an artefact of the old sweep's hot end rather than a
real low-temperature transition, which is a different finding and a better one. (3) The
SRO onset stays where E207 put it, 1100–1250 K, because that observable was never censored.
(4) The high peak lands below the published 2020 K, because v5's ΔE_order (76.5) is
short of the ≈110 meV the mapping needs for 2020 K.
What it settles. If (1) holds, rung 1's factor-of-four deficit was substantially a
measurement window and not a model defect, and every T_c this project has quoted from a
1400 K sweep is a lower bound rather than an estimate. If (1) fails — no peak anywhere up to
3000 K — then the Hamiltonian genuinely does not order despite its ordering energy, and the
sampler is at fault after all.
Results
EXPERIMENTS.md · line 13721
E214 cooling leg complete — prediction (1) FALSIFIED; the ceiling was not the answer (2026-09-21 10:4x)
The 3000 → 100 K leg of E214 is written (35 states, 432 sites, 1000–2000 sweeps per state).
Read straight off the energy, because that is the derivative the peak comes from:
range
energy drop
SRO(Mo–Ta, NN)
3000 → 1100 K
10.3 meV/atom, smooth
−0.009 → −0.053
1100 → 526 K
26.7 meV/atom, accelerating
−0.053 → −0.203
526 → 441 K
20.7 meV/atom in one 85 K step
−0.203 → −0.407
441 → 271 K
9.9 meV/atom
→ −0.500 (B2, floor −152.5)
There is no feature between 1100 and 1800 K. The transition sits at ≈ 480 K, where
E207 (1400 K ceiling), E200 (8³) and E188 all put it. Prediction (1) — a peak in
1100–1800 K that the old ceiling had hidden — is falsified on the cooling leg alone; the
heating leg cannot rescue it, only bound the hysteresis. Prediction (3) holds trivially.
The ceiling reading, which I called the leading explanation four hours ago, is dead.
What survives is harder, not softer.E213 and E213b stand: the Hamiltonian's ordering
energy is nearest-neighbour-like on its own annealing path (R² 0.993) and for first-defect
swaps (0.88× the Ising bar). A nearest-neighbour Ising with that ordering energy orders at
1409 K. The same Hamiltonian, sampled by pyeCE's Monte Carlo with a 3000 K ceiling, orders
at 480 K. That factor of three is now unambiguously internal to model-plus-sampler, and
the same factor on MoNbTaW (3.23) says it is systematic.
The two readings left, and the experiment that separates them. Either (a) pyeCE's
sampler under-orders — wrong by a fixed factor on any Hamiltonian — or (b) the eCE is
not additive over bonds away from the two regimes E213/E213b probed (the annealing path,
and single defects in perfect B2), so the Ising mapping is wrong for the partially ordered
states that decide T_c. E215, pre-registered here: run pyeCE's mcmc on a Hamiltonian
with a known answer — the nearest-neighbour bcc Ising, which pyeCE can express as a
single-pair expansion — at the same 6³ cell and statistics, and read its Cv peak.
Prediction (a): peak at 1409 ± 100 K × (J/J₀), i.e. the sampler reproduces
6.35 J/k_B, and the eCE's non-additivity is the fault. Prediction (b): peak near
470 K for the same J, i.e. the sampler is wrong by 3× on an exactly solvable model, and
every ordering temperature this project has ever reported from ece mcmc is a factor of
three low. One of these is true and the run is cheap. This outranks E210 and v7.
Also on the record from this morning's DFT relaunch: MoNbTaVW crashed at start — the
input named V.pbe-spn-kjpaw_psl.1.0.0.UPF and the file on disk is V.pbe-**spnl**-…
(pslibrary's semicore-l set for vanadium). write_pw had the name hard-coded; E192's inputs
came from a different path and were right. It now resolves the file from the directory and
refuses anything but exactly one match; test added. The cell is re-queued with Mo–Ta.
EXPERIMENTS.md · line 13971
E214 COMPLETE — the ceiling was never the problem (2026-09-21 15:0x)
Mo–Ta, 6³ (432 sites), 3000 → 100 K and back, 35+35 states, 1000–2000 sweeps each.
Read with the run-order leg split, never curve_from_json.
leg
Cv peak
Cv/k_B at peak
max Cv/k_B in 1100–1800 K
SRO onset
cooling 3000→100
526 K
2.09
0.43 (at 1124 K)
1124 K
heating 100→3000
441 K
2.55
0.41 (at 1124 K)
1124 K
(1) FALSIFIED on both legs. No peak exists between 1100 and 1800 K — peak-finding at a
15 % threshold returns one peak per leg and it is the low one. The 1100–1800 K band
carries 5–6× less specific heat than the transition does.
(2) Wrong in form, and the correction is the point. I predicted the 456 K feature would
"survive as a smaller second peak" under a high one. There is no high one: the low
feature is the only peak and it is the main transition.
(3) CONFIRMED exactly. SRO onset 1124 K on both legs, inside the predicted
1100–1250 K, and direction-independent to 0 K.
(4) Vacuous — there is no high peak to compare with the published 2020 K.
T_c(Mo–Ta, v5) = 483 ± 97 K (leg mean; CV-derived bar), against E207's 456 ± 97 at a
1400 K ceiling and E200's 457 at 8³. Doubling the thermostat ceiling moved the answer by
27 K, inside the error bar. Cell size, sampling depth, sweep direction and now ceiling have
each been varied independently and none of them moves this number. The leg gap is 85 K
(cooling above heating), just outside the 65 K reversibility bar and inside the 97 K error
bar; both legs reach the same −152.5 floor and the same 1124 K SRO onset.
The shoulder is the interesting part. At 1124 K — exactly the SRO onset, on both legs —
the specific heat carries a broad shoulder at 0.4 k_B with no local maximum. That is
what local ordering without a global transition looks like, and it is the same reading E207
reached from the Cv/SRO split, now seen directly in one curve.
Where this leaves rung 1. Every explanation outside the sampler is now closed:
the ordering energy agrees with DFT to 5 % (E211 Mo–Ta, both ends measured), the Hamiltonian
is nearest-neighbour-like globally and locally (E213, E213b), and the measurement window is
not censoring anything (this experiment). A nearest-neighbour Ising with DFT's own ΔE_order
orders at 1488 K; this Hamiltonian's own Monte Carlo gives 483 K. E215 — the same sampler
on a Hamiltonian whose T_c is known exactly — is now the only open explanation, and it is
running.
The full record
This entry is written in 3 separate places in the log, shown here in log order.
EXPERIMENTS.md · lines 13599–13613
E214 — pre-registered before it runs (2026-09-21 07:4x)
Mo–Ta, the same cell and statistics as E207, swept 3000 → 100 K and back instead of
1400 → 100. Predictions. (1) A specific-heat peak appears between 1100 and 1800 K
that no 1400 K sweep could show. (2) The 456 K feature survives as a smaller
second peak — if it vanishes, it was an artefact of the old sweep's hot end rather than a
real low-temperature transition, which is a different finding and a better one. (3) The
SRO onset stays where E207 put it, 1100–1250 K, because that observable was never censored.
(4) The high peak lands below the published 2020 K, because v5's ΔE_order (76.5) is
short of the ≈110 meV the mapping needs for 2020 K.
What it settles. If (1) holds, rung 1's factor-of-four deficit was substantially a
measurement window and not a model defect, and every T_c this project has quoted from a
1400 K sweep is a lower bound rather than an estimate. If (1) fails — no peak anywhere up to
3000 K — then the Hamiltonian genuinely does not order despite its ordering energy, and the
sampler is at fault after all.
EXPERIMENTS.md · lines 13721–13763
E214 cooling leg complete — prediction (1) FALSIFIED; the ceiling was not the answer (2026-09-21 10:4x)
The 3000 → 100 K leg of E214 is written (35 states, 432 sites, 1000–2000 sweeps per state).
Read straight off the energy, because that is the derivative the peak comes from:
range
energy drop
SRO(Mo–Ta, NN)
3000 → 1100 K
10.3 meV/atom, smooth
−0.009 → −0.053
1100 → 526 K
26.7 meV/atom, accelerating
−0.053 → −0.203
526 → 441 K
20.7 meV/atom in one 85 K step
−0.203 → −0.407
441 → 271 K
9.9 meV/atom
→ −0.500 (B2, floor −152.5)
There is no feature between 1100 and 1800 K. The transition sits at ≈ 480 K, where
E207 (1400 K ceiling), E200 (8³) and E188 all put it. Prediction (1) — a peak in
1100–1800 K that the old ceiling had hidden — is falsified on the cooling leg alone; the
heating leg cannot rescue it, only bound the hysteresis. Prediction (3) holds trivially.
The ceiling reading, which I called the leading explanation four hours ago, is dead.
What survives is harder, not softer.E213 and E213b stand: the Hamiltonian's ordering
energy is nearest-neighbour-like on its own annealing path (R² 0.993) and for first-defect
swaps (0.88× the Ising bar). A nearest-neighbour Ising with that ordering energy orders at
1409 K. The same Hamiltonian, sampled by pyeCE's Monte Carlo with a 3000 K ceiling, orders
at 480 K. That factor of three is now unambiguously internal to model-plus-sampler, and
the same factor on MoNbTaW (3.23) says it is systematic.
The two readings left, and the experiment that separates them. Either (a) pyeCE's
sampler under-orders — wrong by a fixed factor on any Hamiltonian — or (b) the eCE is
not additive over bonds away from the two regimes E213/E213b probed (the annealing path,
and single defects in perfect B2), so the Ising mapping is wrong for the partially ordered
states that decide T_c. E215, pre-registered here: run pyeCE's mcmc on a Hamiltonian
with a known answer — the nearest-neighbour bcc Ising, which pyeCE can express as a
single-pair expansion — at the same 6³ cell and statistics, and read its Cv peak.
Prediction (a): peak at 1409 ± 100 K × (J/J₀), i.e. the sampler reproduces
6.35 J/k_B, and the eCE's non-additivity is the fault. Prediction (b): peak near
470 K for the same J, i.e. the sampler is wrong by 3× on an exactly solvable model, and
every ordering temperature this project has ever reported from ece mcmc is a factor of
three low. One of these is true and the run is cheap. This outranks E210 and v7.
Also on the record from this morning's DFT relaunch: MoNbTaVW crashed at start — the
input named V.pbe-spn-kjpaw_psl.1.0.0.UPF and the file on disk is V.pbe-**spnl**-…
(pslibrary's semicore-l set for vanadium). write_pw had the name hard-coded; E192's inputs
came from a different path and were right. It now resolves the file from the directory and
refuses anything but exactly one match; test added. The cell is re-queued with Mo–Ta.
EXPERIMENTS.md · lines 13971–14009
E214 COMPLETE — the ceiling was never the problem (2026-09-21 15:0x)
Mo–Ta, 6³ (432 sites), 3000 → 100 K and back, 35+35 states, 1000–2000 sweeps each.
Read with the run-order leg split, never curve_from_json.
leg
Cv peak
Cv/k_B at peak
max Cv/k_B in 1100–1800 K
SRO onset
cooling 3000→100
526 K
2.09
0.43 (at 1124 K)
1124 K
heating 100→3000
441 K
2.55
0.41 (at 1124 K)
1124 K
(1) FALSIFIED on both legs. No peak exists between 1100 and 1800 K — peak-finding at a
15 % threshold returns one peak per leg and it is the low one. The 1100–1800 K band
carries 5–6× less specific heat than the transition does.
(2) Wrong in form, and the correction is the point. I predicted the 456 K feature would
"survive as a smaller second peak" under a high one. There is no high one: the low
feature is the only peak and it is the main transition.
(3) CONFIRMED exactly. SRO onset 1124 K on both legs, inside the predicted
1100–1250 K, and direction-independent to 0 K.
(4) Vacuous — there is no high peak to compare with the published 2020 K.
T_c(Mo–Ta, v5) = 483 ± 97 K (leg mean; CV-derived bar), against E207's 456 ± 97 at a
1400 K ceiling and E200's 457 at 8³. Doubling the thermostat ceiling moved the answer by
27 K, inside the error bar. Cell size, sampling depth, sweep direction and now ceiling have
each been varied independently and none of them moves this number. The leg gap is 85 K
(cooling above heating), just outside the 65 K reversibility bar and inside the 97 K error
bar; both legs reach the same −152.5 floor and the same 1124 K SRO onset.
The shoulder is the interesting part. At 1124 K — exactly the SRO onset, on both legs —
the specific heat carries a broad shoulder at 0.4 k_B with no local maximum. That is
what local ordering without a global transition looks like, and it is the same reading E207
reached from the Cv/SRO split, now seen directly in one curve.
Where this leaves rung 1. Every explanation outside the sampler is now closed:
the ordering energy agrees with DFT to 5 % (E211 Mo–Ta, both ends measured), the Hamiltonian
is nearest-neighbour-like globally and locally (E213, E213b), and the measurement window is
not censoring anything (this experiment). A nearest-neighbour Ising with DFT's own ΔE_order
orders at 1488 K; this Hamiltonian's own Monte Carlo gives 483 K. E215 — the same sampler
on a Hamiltonian whose T_c is known exactly — is now the only open explanation, and it is
running.
Related entries
E207 — does the ordering sweep equilibrate? Heating vs cooling at 10–30× the sweeps (2026-09-20…
E200 — is v5's Mo–Ta T_c finite-size? (2026-09-19 00:01; queued)
E188 — the ordering temperature from v5, against the published Mo–Ta number
E213 — where does v5's ordering energy live? (pre-registered 2026-09-21 07:1x, before measuring)
E213b — the local check, pre-registered before measuring (2026-09-21 07:2x)
E215 — second attempt: the gate failed, and the failure is the finding (2026-09-21 17:4x)
E210 — the reversible protocol on every scorecard system (2026-09-20 23:39; queued behind E207)
E192 — active learning for ordering (2026-09-18 16:30; Liu/Eisenbach 2021 protocol)
E211 — ground states by search, then DFT on each (2026-09-20 23:42; queued after E207, ahead of…