Is the energy model's ordering energy mostly a nearest-neighbour effect?
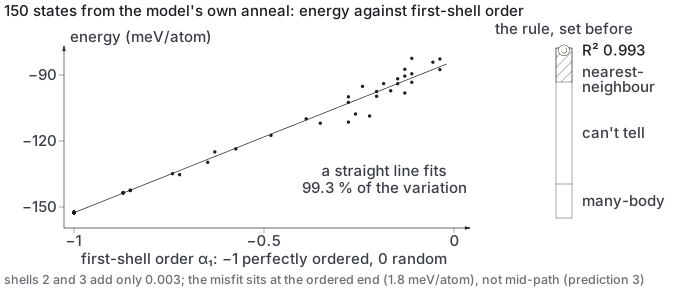
Yes. Nearest-neighbour order alone explains 99.3 % of the energy change along the ordering path; further shells add 0.3 %.
In the log: where does v5's ordering energy live? (pre-registered 2026-09-21 07:1x, before measuring)
mixedDate 2026-09-21 07:1x, as written in the logrung 4 · DFT3 predictions · 1 result paragraphEXPERIMENTS.md lines 13486–13517, lines 13536–13553
What E213 did and how it came out, drawn from this record and the files it names (book/assets/diagrams/exp/E213.svg).
Pre-registration
(1)
α₁ alone gives R² ≥ 0.90. v5 is fitted to DFT formation
energies of bcc alloys where the nearest-neighbour Mo–Ta pair is the dominant interaction
by a factor of two over same-group pairs (Kim & Widom's own hierarchy), so most of the
energy along an ordering path should track α₁.
confirmedbar R² ≥ 0 …
(2)
Adding shells 2 and 3 raises R² by
< 0.05 — they carry little of the variation even if they carry energy.
confirmed** — shells 2 and 3 add **0 …
(3)
The
residual from the α₁-only fit is not random with temperature: it is largest near the
Cv peak (456 K), where many-body correlations are strongest.
falsifiedI predicted the α₁-only residual would be largest near …
The pre-registration, as written
E213 — where does v5's ordering energy live? (pre-registered 2026-09-21 07:1x, before measuring)
The 3× gap above admits two readings and the Bragg–Williams check cannot separate them:
either v5's Monte Carlo under-orders a nearest-neighbour-like Hamiltonian (a sampler or
partition defect), or v5's ordering energy is carried by longer-range and many-body figures
that the NN-Ising mapping mis-handles, in which case the mapping over-predicts and part of
the 3× is an artefact of my own yardstick. Only the second is testable cheaply, and it
decides how to read the first.
Method.E211's five Mo–Ta annealing runs already saved 30 configurations each
(1400 → 10 K), so 150 real 54-site states spanning disordered to B2 are on disk and no new
sampling is needed. For each: v5's formation energy, and the Warren–Cowley parameters per
neighbour shell (forager/physics/order.py::warren_cowley, shells 1–3). Then regress
energy on α₁ alone, on α₁+α₂, and on α₁+α₂+α₃, and report R² for each. The question is how
much of v5's energy variation along its own ordering path a nearest-neighbour pair term
can account for. pyeCE is an embedded expansion with no per-cluster ECIs to read off, so
this correlation route is the available decomposition, not a second-best one.
Predictions.(1) α₁ alone gives R² ≥ 0.90. v5 is fitted to DFT formation
energies of bcc alloys where the nearest-neighbour Mo–Ta pair is the dominant interaction
by a factor of two over same-group pairs (Kim & Widom's own hierarchy), so most of the
energy along an ordering path should track α₁. (2) Adding shells 2 and 3 raises R² by
< 0.05 — they carry little of the variation even if they carry energy. (3) The
residual from the α₁-only fit is not random with temperature: it is largest near the
Cv peak (456 K), where many-body correlations are strongest.
Decision rule, written before the numbers. R² ≥ 0.90 on shell 1 → the ordering energy
is NN-pair-like, the Ising mapping is fair, and the 3× gap is a sampler/partition defect
— rung 1's fault is in the Monte Carlo, not the fit. R² < 0.60 → the mapping over-predicts,
the 1409 K yardstick is withdrawn, and the many-body reading stands. Between 0.60 and
0.90 → indeterminate, and the honest report is that the Bragg–Williams comparison cannot
carry the weight I just put on it.
Results
EXPERIMENTS.md · line 13536
E213 RESULT — the ordering energy is nearest-neighbour, globally and locally (2026-09-21 07:3x)
150 saved states from E211's five Mo–Ta anneals, spanning α₁ = −1.000 (perfect B2) to
−0.037 (essentially random), energies −152.5 to −82.5 meV/atom. The control passes:
the deepest saved state reproduces ground_state.json's −152.5 exactly.
fit
R²
shell 1 (α₁) alone
0.9928
shells 1–2
0.9939
shells 1–3
0.9960
(1) CONFIRMED — bar R² ≥ 0.90, measured 0.9928.
(2) CONFIRMED — shells 2 and 3 add 0.0032, bar < 0.05.
(3) FALSIFIED — I predicted the α₁-only residual would be largest near the Cv peak,
in the middle of the path. It is largest at the most ordered third (1.8 meV) and
≈ 0.0 across the disordered two thirds. Many-body corrections show up where order is
nearly perfect, not where fluctuations are largest.
The full record
This entry is written in 2 separate places in the log, shown here in log order.
EXPERIMENTS.md · lines 13486–13517
E213 — where does v5's ordering energy live? (pre-registered 2026-09-21 07:1x, before measuring)
The 3× gap above admits two readings and the Bragg–Williams check cannot separate them:
either v5's Monte Carlo under-orders a nearest-neighbour-like Hamiltonian (a sampler or
partition defect), or v5's ordering energy is carried by longer-range and many-body figures
that the NN-Ising mapping mis-handles, in which case the mapping over-predicts and part of
the 3× is an artefact of my own yardstick. Only the second is testable cheaply, and it
decides how to read the first.
Method.E211's five Mo–Ta annealing runs already saved 30 configurations each
(1400 → 10 K), so 150 real 54-site states spanning disordered to B2 are on disk and no new
sampling is needed. For each: v5's formation energy, and the Warren–Cowley parameters per
neighbour shell (forager/physics/order.py::warren_cowley, shells 1–3). Then regress
energy on α₁ alone, on α₁+α₂, and on α₁+α₂+α₃, and report R² for each. The question is how
much of v5's energy variation along its own ordering path a nearest-neighbour pair term
can account for. pyeCE is an embedded expansion with no per-cluster ECIs to read off, so
this correlation route is the available decomposition, not a second-best one.
Predictions.(1) α₁ alone gives R² ≥ 0.90. v5 is fitted to DFT formation
energies of bcc alloys where the nearest-neighbour Mo–Ta pair is the dominant interaction
by a factor of two over same-group pairs (Kim & Widom's own hierarchy), so most of the
energy along an ordering path should track α₁. (2) Adding shells 2 and 3 raises R² by
< 0.05 — they carry little of the variation even if they carry energy. (3) The
residual from the α₁-only fit is not random with temperature: it is largest near the
Cv peak (456 K), where many-body correlations are strongest.
Decision rule, written before the numbers. R² ≥ 0.90 on shell 1 → the ordering energy
is NN-pair-like, the Ising mapping is fair, and the 3× gap is a sampler/partition defect
— rung 1's fault is in the Monte Carlo, not the fit. R² < 0.60 → the mapping over-predicts,
the 1409 K yardstick is withdrawn, and the many-body reading stands. Between 0.60 and
0.90 → indeterminate, and the honest report is that the Bragg–Williams comparison cannot
carry the weight I just put on it.
EXPERIMENTS.md · lines 13536–13553
E213 RESULT — the ordering energy is nearest-neighbour, globally and locally (2026-09-21 07:3x)
150 saved states from E211's five Mo–Ta anneals, spanning α₁ = −1.000 (perfect B2) to
−0.037 (essentially random), energies −152.5 to −82.5 meV/atom. The control passes:
the deepest saved state reproduces ground_state.json's −152.5 exactly.
fit
R²
shell 1 (α₁) alone
0.9928
shells 1–2
0.9939
shells 1–3
0.9960
(1) CONFIRMED — bar R² ≥ 0.90, measured 0.9928.
(2) CONFIRMED — shells 2 and 3 add 0.0032, bar < 0.05.
(3) FALSIFIED — I predicted the α₁-only residual would be largest near the Cv peak,
in the middle of the path. It is largest at the most ordered third (1.8 meV) and
≈ 0.0 across the disordered two thirds. Many-body corrections show up where order is
nearly perfect, not where fluctuations are largest.
Related entries
E211 — ground states by search, then DFT on each (2026-09-20 23:42; queued after E207, ahead of…