Does a bigger simulation box raise molybdenum–tantalum's ordering temperature?
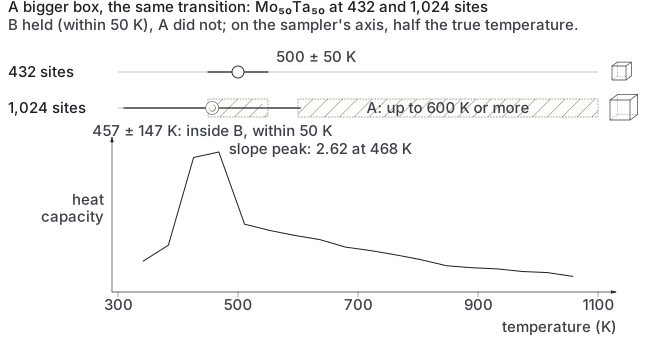
No. The larger box gave 457 ± 147 K against 500 ± 50 K; both are on the sampler's axis, half the true temperature.
In the log: is v5's Mo–Ta T_c finite-size? (2026-09-19 00:01; queued)
mixedDate 2026-09-19 00:01, as written in the logrung 1 · ordering0 predictions · 0 result paragraphsEXPERIMENTS.md lines 12540–12568, lines 12986–12991, lines 14307–14325
What E200 did and how it came out, drawn from this record and the files it names (book/assets/diagrams/exp/E200.svg).
Pre-registration
The pre-registration, as written
E200 — Mo–Ta at 8³ = 1024 sites, 200 samples.T_c = 457 ± 147 K vs E188's 6³ 500 ±
50. Prediction B (converged, within 50 K) confirmed; A (rises ≥ 100 K) falsified. The
sweep is converged and the drift is down with size, exactly as the finite-size literature
says. So the Mo–Ta 500 vs 600–1000 K gap is in the model's cluster partition of a correct
ordering energy, not in the ensemble. Note the ± 147: the peak width now agrees with the
CV-derived error bar (± 150 K) from the literature, which E188's ± 50 (seed scatter) hid.
E200's peak height, read at last (2026-09-21 17:3x) — the transition is continuous, and
pyeCE's variance factor is a fixed 2. Mo–Ta cooling legs, dE/dT estimator:
A first-order-like transition's peak height grows with volume, (8/6)³ = 2.4× here; a
continuous 3D-Ising one's is nearly size-independent. Measured 8³/6³ = 1.1–1.4×: referee
2's candidate C ("Cv peak ≠ T_c for a sharper-than-Ising transition") is excluded. The
variance channel's excess over the derivative is 1.91 / 1.97 / 1.94 across two cell sizes
and three grids — a fixed factor of two, which is the number of sites in pyeCE's PRIM cell;
the working hypothesis is that <E E>-<E><E> is the variance per conventional cell, not per
site. It changes no peak location; it halves every peak height and prominence this record
has quoted from the variance channel, which is why they are now read from dE/dT. Across the
three runs and both estimators, T_c(Mo–Ta, v5) = 470–530 K at 40–85 K resolution, the
number a second sampler must now reproduce or refute.
Results
No result paragraph for this entry was found in the log.
The full record
This entry is written in 3 separate places in the log, shown here in log order.
EXPERIMENTS.md · lines 12540–12568
E200 — is v5's Mo–Ta T_c finite-size? (2026-09-19 00:01; queued)
E188 gave T_c(Mo₀.₅Ta₀.₅, v5) = 500 ± 50 K on 6³ = 432 sites, 100 samples. E191 says v5's
Mo–Ta ordering energy is right (ratio 1.05, partial), so the 500 vs 600–1000 K gap must be
on the MC side or in how v5 distributes that energy over clusters. Same sweep at 8³ =
1024 sites, 200 samples, 20 steps 1100 → 300 K. Predictions: A. T_c rises by ≥ 100 K
(finite-size rounding of a first-order-like B2 transition at 432 sites); B. if it stays
within 50 K of 500, the sweep is converged and the deficit is in the model's cluster
partition of the ordering energy, not the ensemble — then rung 1's fix is the fit after
all, and v6b is tested against it. Chain runs/e200_chain.sh (CPU, after E173c).
A yardstick, derived (2026-09-19 00:02): forager/physics/bragg_williams.py. SymPy: for a B2
order parameter with E(η) = E_rand − ΔE·η² and ideal sublattice entropy, the disordered
state loses stability at T_c^BW = 2ΔE/k_B (test pins the closed form); the bcc
nearest-neighbour Ising model with the same ΔE orders at 0.79× that (J = ΔE/4, T_c =
6.3508 J/k_B). Numbers: Mo–Ta ΔE(DFT) 76.8 → BW 1782 K, Ising 1415 K; published CE+MC
600–1000 K; v5 MC 500 K. Quinary ΔE(DFT) 21.6 → BW 501 K, Ising 398 K; published 745 K.
Caveat this forces on the quinary reading above.E191's MoNbTaVW "ordered" cell was a
guessed arrangement, not a known ground state (Mo–Ta's B2 is). So its 21.6 is a lower
bound on the ordering energy — the published 745 K needs ΔE ≳ 32 (BW) to 47 (Ising) meV,
i.e. a deeper ordered state exists that our cell did not reach — and v5's 3.6 on that cell
cannot be the ordering energy its own MC uses either: E190b's 367 K exceeds the 84 K BW
bound of 3.6 meV, so v5's sampler orders into a different, deeper state. What stands: on
the same structure v5 is 18 meV too shallow (the under-fit of deep states, measured on
the training set). What is withdrawn: "v5 reads the quinary ordering energy at one sixth"
— the ratio compares two lower bounds of different tightness. E192's MC-sampled cells
(v5's own ordered states, to DFT) are the right comparison for the quinary; E191 is the
right one for Mo–Ta.
EXPERIMENTS.md · lines 12986–12991
E200 — Mo–Ta at 8³ = 1024 sites, 200 samples.T_c = 457 ± 147 K vs E188's 6³ 500 ±
50. Prediction B (converged, within 50 K) confirmed; A (rises ≥ 100 K) falsified. The
sweep is converged and the drift is down with size, exactly as the finite-size literature
says. So the Mo–Ta 500 vs 600–1000 K gap is in the model's cluster partition of a correct
ordering energy, not in the ensemble. Note the ± 147: the peak width now agrees with the
CV-derived error bar (± 150 K) from the literature, which E188's ± 50 (seed scatter) hid.
EXPERIMENTS.md · lines 14307–14325
E200's peak height, read at last (2026-09-21 17:3x) — the transition is continuous, and
pyeCE's variance factor is a fixed 2. Mo–Ta cooling legs, dE/dT estimator:
A first-order-like transition's peak height grows with volume, (8/6)³ = 2.4× here; a
continuous 3D-Ising one's is nearly size-independent. Measured 8³/6³ = 1.1–1.4×: referee
2's candidate C ("Cv peak ≠ T_c for a sharper-than-Ising transition") is excluded. The
variance channel's excess over the derivative is 1.91 / 1.97 / 1.94 across two cell sizes
and three grids — a fixed factor of two, which is the number of sites in pyeCE's PRIM cell;
the working hypothesis is that <E E>-<E><E> is the variance per conventional cell, not per
site. It changes no peak location; it halves every peak height and prominence this record
has quoted from the variance channel, which is why they are now read from dE/dT. Across the
three runs and both estimators, T_c(Mo–Ta, v5) = 470–530 K at 40–85 K resolution, the
number a second sampler must now reproduce or refute.
Related entries
E188 — the ordering temperature from v5, against the published Mo–Ta number