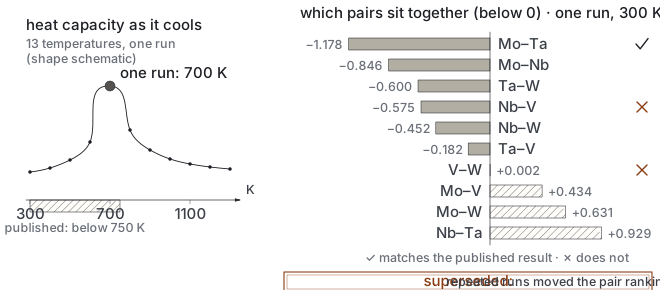
Does our chain reproduce a published ordering temperature and the most strongly paired metals?
Withdrawn. One run gave 700 K and the published strongest pair; repeated runs moved the pair and loosened the temperature to a bound.
In the log: Short-range order and the transition temperature, against an independent result
supersededDate 2026-09-12, as written in the logrung 4 · DFT0 predictions · 1 result paragraphEXPERIMENTS.md lines 1959–2007, lines 2103–2124
What E39 did and how it came out, drawn from this record and the files it names (book/assets/diagrams/exp/E39.svg).
Pre-registration
The pre-registration, as written
E39 is qualified, downward. That entry reported "Mo-Ta strongest, matching published"
and a transition at 700 K. Both came from a single Monte Carlo run. Averaged over four
runs with more data the strongest pair moves to Mo-Nb and then Nb-V, at values (-0.77,
-0.89, -0.82) within noise of one another - the ranking is not robust, and the apparent
agreement with Nguyen-Manh et al. on the dominant pair was over-read from one sample. The
transition remains consistent with their "below 750 K", but as a loose bound rather than
the clean agreement E39 presented.
Wang-Landau, which is the right method, does not converge here out of the box. It gives
the density of states and so the heat capacity continuously in temperature, instead of a
ladder that can only report where it stopped. Three attempts left the fill factor at 1.0
with no density of states produced: the histogram never flattens. The icet documentation
describes exactly this for larger systems - the ratio between the maximum and minimum of
the density of states grows with size - and prescribes splitting the energy range into
segments sampled separately and patched together. That is infrastructure, not a parameter,
and is recorded as the route rather than attempted further.
What would actually reduce the 130 K. Longer runs and more of them, since the scatter
is sampling; finite-size scaling across cell sizes, which Pei and co-workers
(Comput. Phys. Commun.235, 95, 2018) use via the fourth-order energy cumulant and
which bounded their FeCo transition to 840-930 K; and eventually the binned Wang-Landau
treatment. None of these is a data-volume problem.
Results
EXPERIMENTS.md · line 1959
E39 — Short-range order and the transition temperature, against an independent result
Date 2026-09-12 · Question (operator) The deliverable is short-range order and
order-disorder transition temperatures, not the lowest free energy. Can this chain produce
them, and do they agree with anyone else's? · Provenanceforager/order.py,
…/sro_validate.py
What was already being computed and thrown away. Thermodynamic integration walks a
temperature ladder from 20,000 K down to its target and reduces every rung to one mean
energy. The occupancies on those rungs are the Warren-Cowley parameters and the energy
fluctuations are the heat capacity whose peak is the transition. Both were being generated
and discarded on every call.
Method. Equimolar MoNbTaVW, 128 sites (a 3x3x3 cell self-interacts with these cutoffs,
E31), canonical Monte Carlo annealed down thirteen temperatures from 2500 K to 300 K, 60
sweeps per site to equilibrate and 160 to sample. Warren-Cowley in de Fontaine's
multicomponent form; the transition from the heat capacity Var(E)/(k_B T^2) per site.
The comparison. Nguyen-Manh and co-workers (UKAEA) computed this system with a cluster
expansion fitted to 428 bcc DFT structures, cross-validated at about 8 meV/atom, and
reported three things. No connection to this project.
published
ours
order-disorder transition
below 750 K
700 K, prominence 1.66
strongest first-shell pair
Mo-Ta
Mo-Ta, -1.178
V-W
comparably negative
+0.002
Nb-V
segregating
-0.575, i.e. ordering
Two reproduced, two not. The transition temperature and the dominant ordering pair come
out independently, which is the first outside agreement this project has obtained. The
weaker pair preferences do not.
Why, and it is checkable rather than an excuse. Our expansion is fitted to a potential
that sits 6.61 meV/atom from DFT (E18); theirs is fitted to DFT. The Mo-Ta interaction
is strong enough to survive that error and the subtler preferences are not - they are
smaller than our own error bar. The rule this implies, and which can be tested rather than
assumed: only order parameters driven by interactions larger than about 7 meV/atom should
be believed from this chain. V-W and Nb-V are exactly the cases that rule would exclude.
Full first-shell parameters at 300 K (negative means the pair sits together):
Mo-Ta -1.178, Mo-Nb -0.846, Ta-W -0.600, Nb-V -0.575, Nb-W -0.452, Ta-V -0.182,
V-W +0.002, Mo-V +0.434, Mo-W +0.631, Nb-Ta +0.929.
Caveats. One composition, one cell, one annealing schedule, no repeats - the ordering
strength wanders between 0.075 and 0.22 above 1500 K where it should be near zero, which is
the noise floor of a single run and not a physical signal. The transition is located to the
spacing of the ladder, 100 K around 700. None of that is fixed by looking at it harder; it
needs repeats and a finer ladder, and the cell-size axis remains unmeasured.
The full record
This entry is written in 2 separate places in the log, shown here in log order.
EXPERIMENTS.md · lines 1959–2007
E39 — Short-range order and the transition temperature, against an independent result
Date 2026-09-12 · Question (operator) The deliverable is short-range order and
order-disorder transition temperatures, not the lowest free energy. Can this chain produce
them, and do they agree with anyone else's? · Provenanceforager/order.py,
…/sro_validate.py
What was already being computed and thrown away. Thermodynamic integration walks a
temperature ladder from 20,000 K down to its target and reduces every rung to one mean
energy. The occupancies on those rungs are the Warren-Cowley parameters and the energy
fluctuations are the heat capacity whose peak is the transition. Both were being generated
and discarded on every call.
Method. Equimolar MoNbTaVW, 128 sites (a 3x3x3 cell self-interacts with these cutoffs,
E31), canonical Monte Carlo annealed down thirteen temperatures from 2500 K to 300 K, 60
sweeps per site to equilibrate and 160 to sample. Warren-Cowley in de Fontaine's
multicomponent form; the transition from the heat capacity Var(E)/(k_B T^2) per site.
The comparison. Nguyen-Manh and co-workers (UKAEA) computed this system with a cluster
expansion fitted to 428 bcc DFT structures, cross-validated at about 8 meV/atom, and
reported three things. No connection to this project.
published
ours
order-disorder transition
below 750 K
700 K, prominence 1.66
strongest first-shell pair
Mo-Ta
Mo-Ta, -1.178
V-W
comparably negative
+0.002
Nb-V
segregating
-0.575, i.e. ordering
Two reproduced, two not. The transition temperature and the dominant ordering pair come
out independently, which is the first outside agreement this project has obtained. The
weaker pair preferences do not.
Why, and it is checkable rather than an excuse. Our expansion is fitted to a potential
that sits 6.61 meV/atom from DFT (E18); theirs is fitted to DFT. The Mo-Ta interaction
is strong enough to survive that error and the subtler preferences are not - they are
smaller than our own error bar. The rule this implies, and which can be tested rather than
assumed: only order parameters driven by interactions larger than about 7 meV/atom should
be believed from this chain. V-W and Nb-V are exactly the cases that rule would exclude.
Full first-shell parameters at 300 K (negative means the pair sits together):
Mo-Ta -1.178, Mo-Nb -0.846, Ta-W -0.600, Nb-V -0.575, Nb-W -0.452, Ta-V -0.182,
V-W +0.002, Mo-V +0.434, Mo-W +0.631, Nb-Ta +0.929.
Caveats. One composition, one cell, one annealing schedule, no repeats - the ordering
strength wanders between 0.075 and 0.22 above 1500 K where it should be near zero, which is
the noise floor of a single run and not a physical signal. The transition is located to the
spacing of the ladder, 100 K around 700. None of that is fixed by looking at it harder; it
needs repeats and a finer ladder, and the cell-size axis remains unmeasured.
EXPERIMENTS.md · lines 2103–2124
E39 is qualified, downward. That entry reported "Mo-Ta strongest, matching published"
and a transition at 700 K. Both came from a single Monte Carlo run. Averaged over four
runs with more data the strongest pair moves to Mo-Nb and then Nb-V, at values (-0.77,
-0.89, -0.82) within noise of one another - the ranking is not robust, and the apparent
agreement with Nguyen-Manh et al. on the dominant pair was over-read from one sample. The
transition remains consistent with their "below 750 K", but as a loose bound rather than
the clean agreement E39 presented.
Wang-Landau, which is the right method, does not converge here out of the box. It gives
the density of states and so the heat capacity continuously in temperature, instead of a
ladder that can only report where it stopped. Three attempts left the fill factor at 1.0
with no density of states produced: the histogram never flattens. The icet documentation
describes exactly this for larger systems - the ratio between the maximum and minimum of
the density of states grows with size - and prescribes splitting the energy range into
segments sampled separately and patched together. That is infrastructure, not a parameter,
and is recorded as the route rather than attempted further.
What would actually reduce the 130 K. Longer runs and more of them, since the scatter
is sampling; finite-size scaling across cell sizes, which Pei and co-workers
(Comput. Phys. Commun.235, 95, 2018) use via the fourth-order energy cumulant and
which bounded their FeCo transition to 840-930 K; and eventually the binned Wang-Landau
treatment. None of these is a data-volume problem.
Related entries
E31 — The reference cell was too small for its own clusters
E18 — MACE-MPA-0 validated on 300 independent DFT structures