No result paragraph for this entry was found in the log.
EXPERIMENTS.md · lines 2700–2764E52 — The transition was never +/- 173 K; the estimator was throwing the precision away
The order-disorder map was too noisy for any learner: a small neural network reached AUC
0.998 on a smooth synthetic target drawn from the same 150 compositions and 0.565 on the
real objective, which says the labels carried nothing, not that the learner was weak. Four
things were measured to find out why.
The heat capacity was the wrong quantity. It was being reconstructed as a finite
difference of six mean energies; CEThermo.integrate computes the Monte Carlo trace and
kept only its mean, discarding the variance that is the heat capacity. Returning the
variance changed the physics: genuine transitions went from 33 of 150 to 138 of 150,
and peaks clipped at the edge of the scanned range from 69 to 7.
Wang-Landau is not affordable here, measured rather than assumed. The literature's
first recommendation. order_disorder_wang_landau had never produced a number - it
returns a fill factor of exactly 1.0, because with no energy limits the histogram must
cover arrangements that are never visited and so never flattens. Bounded to the window the
alloy actually occupies, 60 bins took 16,000 sweeps and 123 s for the fill factor to halve
once, against the thirteen more halvings a usable density of states needs; 120 bins
never moved at all. Hours per composition against eleven seconds for a temperature ladder.
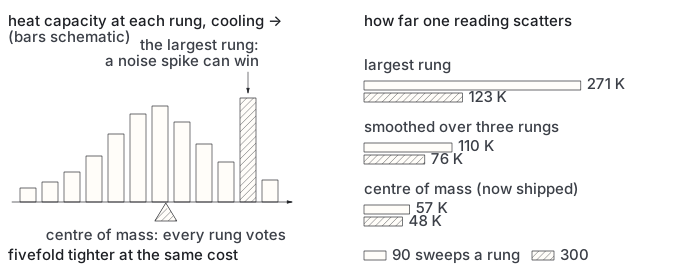
A finer ladder made it worse. 29 rungs at 50 K scattered by 271 K against 198 K
for 8 rungs - and the two runs also differed in sampling, which was a second fault in the
comparison. Grid resolution was not the limit.
The limit was taking the largest of a set of noisy numbers. Each rung's heat capacity
is a variance estimated from a finite trace and carries its own error, so argmax moves
whenever noise outbids the true maximum, and more rungs give noise more chances. Three
estimators, same compositions, same five seeds:
The centre of mass uses every rung, so no single noisy one can carry it. It cuts the
scatter nearly fivefold at identical cost, and is now what order_disorder reports;
the largest rung is still returned alongside as temperature_argmax.
This supersedes the +/- 173 K of E41, which measured an estimator rather than a
transition.
Against the literature, and what the estimator was costing. 69 published transition
temperatures for equimolar alloys inside these eight elements (Lederer, Toher, Vecchio and
Curtarolo, Acta Mater. 159, 364), the same compositions through both estimators:
Reading the same curves differently nearly doubles the agreement, which is the clearest
evidence that the estimator was the limitation and not the physics. At +0.638 the map has
the ordering of these alloys substantially right, which is the part a search needs.
A scale error remains: ours run about 2.2x low. A constant factor is worth far more
than scatter, because it can be characterised and quoted rather than merely suffered. Two
candidates, neither yet tested. The expansion is fitted at one fixed lattice constant,
3.2935 A, for every composition, while a real alloy's lattice parameter moves with what
is in it. And the published values are themselves mean field, which the literature puts
25-30% high, closing part of the gap from the other side. Note the direction: an expansion
fitted to unrelaxed energies was expected to run high, and it runs low, so whatever is
happening is not the relaxation bias.