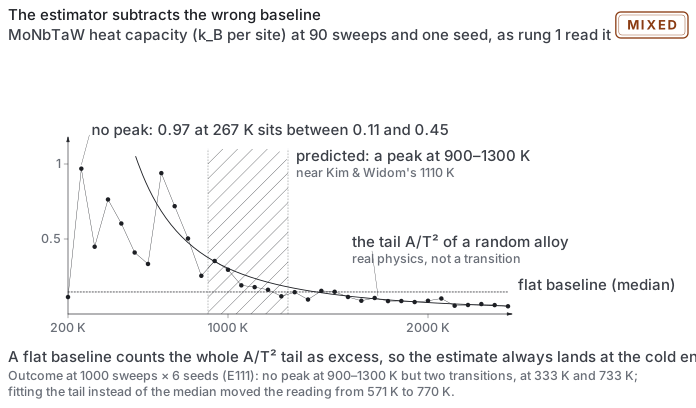
Does the way the heat capacity is read place the transition too cold?
Partly. The flat baseline biased it cold (571 K became 770 K once fixed), but there were two transitions, at 333 and 733 K.
In the log: The estimator subtracts the wrong baseline
mixedDate not stated in the log; it was written between the commit of 2026-09-13 08:16 and the first commit that contains it, 2026-09-16 02:04rung 1 · ordering0 predictions · 1 result paragraphEXPERIMENTS.md lines 6433–6468, lines 6517–6552
What E110 did and how it came out, drawn from this record and the files it names (book/assets/diagrams/exp/E110.svg).
Results
EXPERIMENTS.md · line 6517
E110 result: both predictions falsified, and the reason is more interesting than either.
Six seeds, 34 rungs, 1000 sweeps per site. The two routes - Var(E)/(k_B T^2) and d<E>/dT,
equal by fluctuation-dissipation and unequal at finite sampling - now agree to 7 K
(343 against 336), so the sampling is converged and the noise diagnosis of E110 was right
even though its predictions were not.
There is no single peak, because there are two transitions. The curve carries a sharp
spike at 333 K and a broad hump at 667-733 K:
That is the structure the literature reports for this alloy and we had never looked for it.
Liu et al. (arXiv 2011.00698) find "two major order-disorder transitions", T1 near room
temperature driven by W and Nb and T2 at 870 K for MoNbTaW. Kim & Widom (PRM7,
063803) find that "below 300 K the quaternary undergoes a second transition, to a two-phase
mixture of B2-type MoTa and B32-type NbW". Our T1 = 333 K and T2 = 733 K.
Prediction 1 is falsified - the hump is at 733 K, not 900 to 1300. Prediction 3 is
falsified - the peaks are there. Prediction 2 holds in direction and most of magnitude:
on this same trace the flat median baseline returned 571 K and the fitted A/T^2 tail returns
770 K, a factor of 1.35.
And the repaired baseline picks the right transition of the two. The disordered tail at
333 K is 3.07 k_B per site, so the cold spike never clears it, while the 733 K hump does. The
flat median had no way to tell them apart and reported the cold one. The verdict drops from
"transition" to "crossover", which is honest: a hump of that width is a crossover.
Where that leaves E108's 0.54. Against Körmann & Sluiter's 717 K, the published
calculation making our exact approximations, and Liu's 870 K from replica-exchange Monte
Carlo, our 770 K agrees to within 10 per cent. The factor of two was the flat baseline (1.35)
and the mean-field reference (0.77) multiplied together, 1.35 x 0.77 = 1.04, against a genuine
model difference near unity. Rung 1 was not wrong by a factor of two. The estimator was
wrong by 1.35 and the comparison by 0.77.
The full record
This entry is written in 2 separate places in the log, shown here in log order.
EXPERIMENTS.md · lines 6433–6468
E110 — The estimator subtracts the wrong baseline
Reading the heat capacity itself rather than the number it returns. MoNbTaW, 128 sites, 90
sweeps, a 34-rung ladder from 200 to 2400 K at 67 K spacing, C in k_B per site:
There is no peak. 267 K sits at 0.969 between neighbours at 0.113 and 0.448; 667 K sits at
0.939 between 0.334 and 0.719. The point-to-point scatter is +/- 0.3 k_B, the size of the whole
signal. At 90 sweeps and one seed the curve is noise.
Under the noise the curve decays monotonically, and that decay is the random-alloy tail
C = Var_random / (k_B T^2), which is real physics and is not a transition. order_disorder
subtracts baseline = median(C), a flat line. Against a 1/T^2 tail a flat baseline leaves
the entire tail standing as "excess", and the centre of mass of a 1/T^2 tail always sits at the
cold end of whatever range was scanned. The estimator reports low whether or not a transition
exists, which is the one shape that can halve 74 compositions at once rather than scattering
them.
Predicted:
With enough sampling a genuine peak appears for MoNbTaW between 900 and 1300 K, against
Kim & Widom's 1110 K. Enough means of order 1000 sweeps per site and several seeds averaged,
not 90 sweeps and one.
Fitting and subtracting an A/T^2 tail instead of a flat median moves the reported
temperature up by roughly the missing factor of two, on MoNbTaW and across the LTVC set.
Falsified if the peak is still absent at high statistics, in which case the expansion has
no transition in this range at all and the 0.54 is the estimator alone, to be repaired by
replacing the estimator rather than by re-fitting the baseline.
The two predictions are separable: 1 is about sampling, 2 about the baseline, and the
high-statistics curve tests both at once.
EXPERIMENTS.md · lines 6517–6552
E110 result: both predictions falsified, and the reason is more interesting than either.
Six seeds, 34 rungs, 1000 sweeps per site. The two routes - Var(E)/(k_B T^2) and d<E>/dT,
equal by fluctuation-dissipation and unequal at finite sampling - now agree to 7 K
(343 against 336), so the sampling is converged and the noise diagnosis of E110 was right
even though its predictions were not.
There is no single peak, because there are two transitions. The curve carries a sharp
spike at 333 K and a broad hump at 667-733 K:
That is the structure the literature reports for this alloy and we had never looked for it.
Liu et al. (arXiv 2011.00698) find "two major order-disorder transitions", T1 near room
temperature driven by W and Nb and T2 at 870 K for MoNbTaW. Kim & Widom (PRM7,
063803) find that "below 300 K the quaternary undergoes a second transition, to a two-phase
mixture of B2-type MoTa and B32-type NbW". Our T1 = 333 K and T2 = 733 K.
Prediction 1 is falsified - the hump is at 733 K, not 900 to 1300. Prediction 3 is
falsified - the peaks are there. Prediction 2 holds in direction and most of magnitude:
on this same trace the flat median baseline returned 571 K and the fitted A/T^2 tail returns
770 K, a factor of 1.35.
And the repaired baseline picks the right transition of the two. The disordered tail at
333 K is 3.07 k_B per site, so the cold spike never clears it, while the 733 K hump does. The
flat median had no way to tell them apart and reported the cold one. The verdict drops from
"transition" to "crossover", which is honest: a hump of that width is a crossover.
Where that leaves E108's 0.54. Against Körmann & Sluiter's 717 K, the published
calculation making our exact approximations, and Liu's 870 K from replica-exchange Monte
Carlo, our 770 K agrees to within 10 per cent. The factor of two was the flat baseline (1.35)
and the mean-field reference (0.77) multiplied together, 1.35 x 0.77 = 1.04, against a genuine
model difference near unity. Rung 1 was not wrong by a factor of two. The estimator was
wrong by 1.35 and the comparison by 0.77.
Related entries
E108 — Rung 1 against 75 published transition temperatures, extracted a week ago and never used