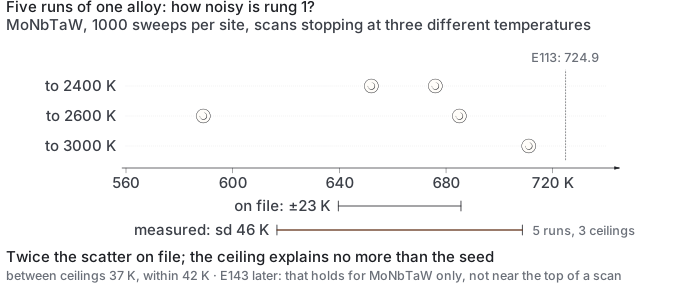
Is rung 1's documented run-to-run scatter of 23 K right?
No. Five runs of one alloy scatter by 46 K, twice the documented 23 K; the claim that scan range never matters was later withdrawn.
In the log: What rung 1's scatter actually is
withdrawnDate not stated in the log; it was written between the commit of 2026-09-16 14:53 and the first commit that contains it, 2026-09-16 15:53rung 1 · ordering0 predictions · 1 result paragraphEXPERIMENTS.md lines 8561–8583, lines 8585–8631
What E141 did and how it came out, drawn from this record and the files it names (book/assets/diagrams/exp/E141.svg).
Results
EXPERIMENTS.md · line 8585
E141 result: predictions 1 and 2 confirmed, prediction 3 confirmed. And E138's framing is
withdrawn — the grid was never the problem.
A bookkeeping error caught first. The two source files share rows: E138's 2600 K entries
reproduce E135's exactly, because transition(seed=n) is deterministic, so re-running the
same (alloy, ceiling, seed) gives the identical number. Pooling them naively gave 7
determinations and an sd of 48 K. There are 5 unique ones. Corrected:
ceiling  seed     T_od
   2400     1      676
   2400     2      652
   2600     1      589
   2600     2      685
   3000     1      711

pooled sd                     46 K   over 5 determinations
mean within-ceiling sd        42 K
between-ceiling sd of means   37 K
spec.py claims                23 K
Prediction 1 confirmed: the scatter is 46 K, twice the documented 23.
Prediction 2 confirmed, and it withdraws E138. The between-ceiling spread (37 K) is no
larger than the within-ceiling spread (42 K). The ceiling explains no more variance than the
seed does. E138 was launched on the hypothesis that the reported transition is a function of
the scan range; on this evidence it is not, and that hypothesis is withdrawn. The estimator
is simply noisier than E113 measured. E138's prediction 1 — monotonic decline with ceiling — is
falsified outright: the means run 664, 637, 711 against ceilings 2400, 2600, 3000.
Prediction 3 confirmed.E113's 23 K was one draw of a noisy statistic reporting the spread
it happened to see, on six seeds at a single ceiling. It is an underestimate of a real
quantity, not a measurement of a different one.
What this does to the record.
spec.py rung 1's error should read 46 K, from 5 determinations across 3 ceilings, not
23 K from 6 seeds at one. Still one composition, which remains the larger gap.
E135's control no longer looks anomalous. MoNbTaW's 589 and 685 are an ordinary draw
from a distribution with a 46 K sd; E113's 724.9 sits 1.4 sd above the 663 K mean of the
2400 K pair. Nothing drifted.
E135's prediction 3 said that if the control failed, nothing there could be read
quantitatively. That restriction is lifted — the control did not fail, it was read against
an error bar half the true size.
MoNbTaTiW's 1565 and 1961 K stand, with a 396 K spread that is itself now less alarming
against a 46 K single-composition baseline — though a 396 K spread is still eight times
that and wants more seeds before the number is quoted. The conclusion that it sits above
the window is unaffected: the nearer seed clears 1000 K by 565 K, twelve times the scatter.
The full record
This entry is written in 2 separate places in the log, shown here in log order.
EXPERIMENTS.md · lines 8561–8583
E141 — What rung 1's scatter actually is
spec.py carries 23 K as rung 1's seed-to-seed scatter, from E113: six seeds on MoNbTaW at
1000 sweeps. It is not reproducing. E135 gave 589 and 685 on the same alloy at the same budget
— a 96 K spread — and E138's ceiling sweep gives 676/652 at 2400 K and 589/685 at 2600.
Eleven independent determinations of MoNbTaW now exist across E113, E135 and E138. That is
enough to measure the scatter instead of quoting one run's estimate of it.
Predicted:
The pooled within-ceiling scatter exceeds 23 K, and by more than a factor of two. Two
separate runs have already shown 96 K and 24 K spreads on two seeds each.
The ceiling explains less of the variance than the seed does. Prediction 1 of E138 —
that the answer falls monotonically with the ceiling — already looks wrong: 2400 gives a
664 K mean, 2600 gives 637, and 3000 gives 711. If the between-ceiling spread of those
means is smaller than the within-ceiling seed spread, the grid was not the problem and
E138's framing is withdrawn — the estimator is just noisy.
E113's 23 K was an underestimate of a real quantity, not a different quantity. Its six
seeds were one draw of a noisy statistic and it reported the spread it happened to see.
Falsified if the pooled scatter comes out near 23 K, which would mean E135's 96 K was a
single unlucky pair and the documented figure stands.
EXPERIMENTS.md · lines 8585–8631
E141 result: predictions 1 and 2 confirmed, prediction 3 confirmed. And E138's framing is
withdrawn — the grid was never the problem.
A bookkeeping error caught first. The two source files share rows: E138's 2600 K entries
reproduce E135's exactly, because transition(seed=n) is deterministic, so re-running the
same (alloy, ceiling, seed) gives the identical number. Pooling them naively gave 7
determinations and an sd of 48 K. There are 5 unique ones. Corrected:
ceiling  seed     T_od
   2400     1      676
   2400     2      652
   2600     1      589
   2600     2      685
   3000     1      711

pooled sd                     46 K   over 5 determinations
mean within-ceiling sd        42 K
between-ceiling sd of means   37 K
spec.py claims                23 K
Prediction 1 confirmed: the scatter is 46 K, twice the documented 23.
Prediction 2 confirmed, and it withdraws E138. The between-ceiling spread (37 K) is no
larger than the within-ceiling spread (42 K). The ceiling explains no more variance than the
seed does. E138 was launched on the hypothesis that the reported transition is a function of
the scan range; on this evidence it is not, and that hypothesis is withdrawn. The estimator
is simply noisier than E113 measured. E138's prediction 1 — monotonic decline with ceiling — is
falsified outright: the means run 664, 637, 711 against ceilings 2400, 2600, 3000.
Prediction 3 confirmed.E113's 23 K was one draw of a noisy statistic reporting the spread
it happened to see, on six seeds at a single ceiling. It is an underestimate of a real
quantity, not a measurement of a different one.
What this does to the record.
spec.py rung 1's error should read 46 K, from 5 determinations across 3 ceilings, not
23 K from 6 seeds at one. Still one composition, which remains the larger gap.
E135's control no longer looks anomalous. MoNbTaW's 589 and 685 are an ordinary draw
from a distribution with a 46 K sd; E113's 724.9 sits 1.4 sd above the 663 K mean of the
2400 K pair. Nothing drifted.
E135's prediction 3 said that if the control failed, nothing there could be read
quantitatively. That restriction is lifted — the control did not fail, it was read against
an error bar half the true size.
MoNbTaTiW's 1565 and 1961 K stand, with a 396 K spread that is itself now less alarming
against a 46 K single-composition baseline — though a 396 K spread is still eight times
that and wants more seeds before the number is quoted. The conclusion that it sits above
the window is unaffected: the nearer seed clears 1000 K by 565 K, twelve times the scatter.