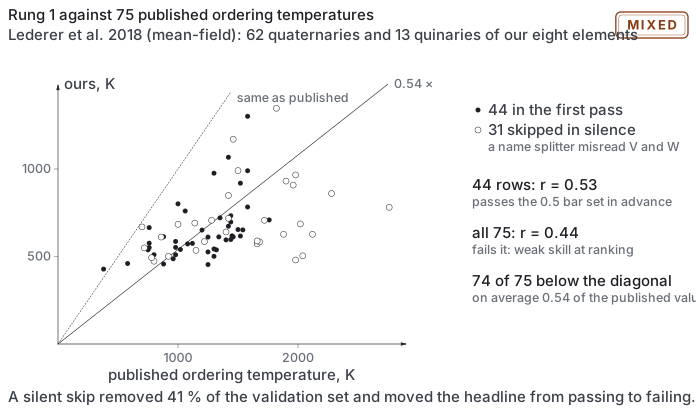
EXPERIMENTS.md · lines 6283–6381E108 — Rung 1 against 75 published transition temperatures, extracted a week ago and never used
The memory note sro-odt-ladder-prior-art was written on 14 September and lists three things
that fill gaps in this ladder. None was acted on, and one of them - the LTVC table - is a
ready-made validation set for rung 1 that has been sitting in a scratchpad since.
Lederer, Toher, Vecchio & Curtarolo, Acta Materialia 159, 364 (2018) estimate ordering
temperatures for every equimolar combination of Hf, Mo, Nb, Ta, Ti, V, W, Zr - our exact
eight - from an AFLOW cluster expansion under a generalised quasichemical mean-field
treatment. 62 quaternaries and 13 quinaries are extracted. Mean field runs high and the
authors quote about ±25 %, so this is a scale to agree with rather than a truth to match.
The single comparison already made contradicts my own note. That note argued our
expansion is fitted to unrelaxed MACE energies, that relaxation lowers T_c by about 30 %
(Körmann & Sluiter 2016; Kostiuchenko 2019), and therefore that "our map is probably
systematically high". Measured on MoNbTaW: ours 556 K against LTVC's 1000 - low by 44 %,
the opposite direction.
Predicted, across all 75:
- Rung 1 correlates positively with LTVC, Pearson above 0.5. If it does not, rung 1
cannot rank compositions at all and the ordering rung needs rebuilding rather than tuning.
- Ours is systematically LOW, not high - the note's reasoning is wrong, and the MoNbTaW
point is representative rather than an outlier. Expect a mean ratio near 0.5-0.7.
- The scatter is large: LTVC carries ±25 % and our own seeds carry ±100 K, so expect a
spread of 30 % or more even if the trend is clean.
Falsified if the correlation is near zero, which would mean rung 1's ordering
temperatures have no skill against the only external reference this project has.
Run on the 8-element expansion, since that is the set LTVC covers. Checkpointed per
composition.
Outcome, on 44 of the 75. Rung 1 has weak skill and halves every temperature.
Prediction 2 holds and my own note is withdrawn with it. sro-odt-ladder-prior-art
argued from the unrelaxed-MACE fit that "our map is probably systematically high". It is
systematically low, by a factor of two, on 43 of 44 compositions.
And it is not an artefact of LTVC being mean-field. Mean field runs high, so part of the
gap is expected - but Kim & Widom (Phys. Rev. Materials 7, 063803, 2023) put MoNbTaW at
T_c ≈ 1110 K from replica-exchange Monte Carlo, not mean field, against our 556.
Same factor of two, from a method with no mean-field bias to explain it away. If LTVC is
25 % high as its authors quote, our values are still about 30 % below the corrected scale.
The consequence is not that the numbers are wrong by a constant. A factor of two on T_od
moves compositions across the window boundary in both directions: things recorded as ordering
below 90 K may order inside it, and things recorded as ordering inside it at 500-600 K may
order above 1000 K and be compounds throughout. Every verdict in this file that turned on
where T_od sits relative to the window is affected, including the four re-measured in E82
and the gate validation of E98 and E99, which compared a cheap estimator against this rung as
if this rung were the truth.
What it does not overturn. The ranking survives at rho 0.64 - rung 1 orders compositions
roughly correctly while placing them all too low. A scale error is repairable; no skill would
not have been.
The likely cause is the one thing the note got right. The expansion is fitted to MACE
energies on the ideal, unrelaxed lattice, and Casillas-Trujillo et al. (PRM 8, 113803,
2024) find the foundation potentials reproduce mixing enthalpies poorly - the exact quantity
ordering depends on. E78 validated MACE against DFT to 1 and 4 meV/atom, but on three
structures, unrelaxed, at one composition each. Three points do not cover a systematic claim
about mixing enthalpies across a 12-element space.
Completed, 75 of 75 — and my own bug had flattered the result.
The name splitter took two characters at a time. Five of these eight symbols are two
characters and three are one, so MoNbVW became Mo, Nb, "VW", failed the membership test,
and was skipped in silence. It dropped 31 of 75 compositions - every one where V or W
sits anywhere but last.
Prediction 1 is falsified on the complete set. r = 0.439 against the 0.5 I set as the
threshold for "rung 1 can rank compositions at all". The ranking correlation is 0.53, which
is skill but weak skill: rung 1 gets the order roughly right about three times in four.
The scale error is unchanged and now rests on 75 points rather than 44: rung 1 reports
ordering temperatures at 0.54 of the published scale, on 74 of 75 compositions.
The methodological point is the one to keep. A silent skip in an analysis script removed
41 per cent of a validation set and moved the headline correlation from passing to failing.
Nothing errored. The script printed 44 rows where 75 were expected and I read the summary
statistics rather than the count.