EXPERIMENTS.md · lines 5484–5571E95 — Where the screen actually asks for an activation energy
The survey is stopped: swap stood at 8.4 GB of 9.2 and the workers, twice replaced after
being killed for memory, produced nothing in an hour. The 54-atom DFT run needs 2.75 GB and
was there first. MACE and that job cannot share this machine, so the measurement waits and
the design is fixed instead - which is the part that was wrong anyway.
E94 found the flaw: the set is stratified evenly by element count, and five of its first six
compositions are rejected by the screen. Q is only ever asked about compositions that
survive the thermodynamics, so a proxy calibrated on an even spread is accurate mostly
where it is never used.
This measures the promoted region directly - 20,000 random compositions through the free
rung, which is milliseconds each and needs no potential. The test uses drive_cold, the
thermodynamic driving force, and deliberately not the kinetic verdict: the kinetic term
contains the Q estimate under repair, and selecting a calibration set with it would be
circular.
Predicted:
- Promoted compositions are a small fraction of the space, under 10 per cent of random
draws.
- They occupy a narrow band in melting point - a standard deviation under 300 K,
against roughly 700 K across the space - because the driving force rewards the refractory
corner.
- They are not narrow in element count. E94 already showed a two-element alloy and an
eight-element alloy with the same Q, so element count is not what the screen selects on,
and a set stratified by it samples the wrong axis.
A failure of 2 would be the good outcome: it would mean the promoted region is wide, an
even spread is a reasonable calibration set after all, and the survey as designed was fine.
A regression of mine, found while trying to use the screen: it is eight times slower than
it is documented to be.
Scanning 20,000 compositions should have taken 90 seconds and did not finish. Measured: the
screen now costs 35.1 ms against the 4.4 ms recorded in its own docstring, and the
12-temperature sweep added in E91 is 21 ms of it - one hull query is 1.8 ms and it is made
twelve times.
rungs.py has said all along that the driving force is linear in temperature: the energies
are fixed and only the entropy term moves. If that is true then ten of the twelve queries are
waste.
Predicted: the driving force is linear in temperature to floating point, so two hull
queries and an interpolation reproduce the twelve-point sweep exactly, and the screen returns
to about 14 ms. Falsified if any composition departs from the straight line through its two
endpoints by more than 1 meV/atom - which would mean the hull's cheapest mixture changes
identity partway through the window, and the linearity claim in rungs.py is wrong and needs
withdrawing wherever it is relied on.
Outcome. The linearity holds exactly, the screen is fixed, and two of three predictions
about the promoted region are wrong.
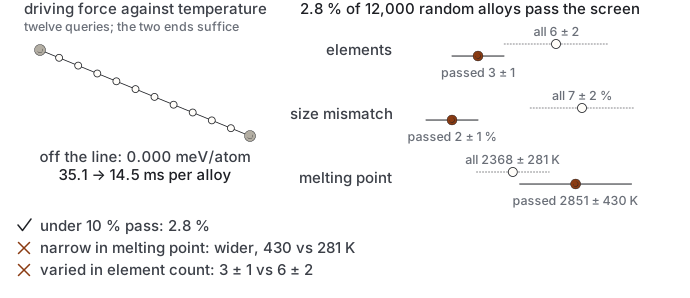
The driving force departs from the straight line through its endpoints by 0.000 meV/atom
across forty compositions of two to twelve elements, so the twelve-temperature sweep now
interpolates between d_cold and d_hot, which were already computed. The screen went
from 35.1 ms to 14.5, with verdicts unchanged. It is still three times its documented 4.4
ms, and most of the remainder is not the kinetic term: the twelve-element expansion has 1068
parameters against 344, and its energy alone costs 5.2 ms.
The promoted region, 12,000 random compositions through the free rung:
Prediction 1 holds: 2.8 per cent, comfortably under ten. Prediction 2 is falsified - the
promoted band is not narrow in melting point but shifted upward and wider, 430 K against
281. Prediction 3 is falsified too, and more usefully: promoted compositions are sharply
narrow in element count, three plus or minus one against six plus or minus two, and narrow in
size misfit, two per cent against seven. The axes the screen selects on are misfit and
element count, not melting point.
But this measures the region promoted by the THERMODYNAMIC driving force, and that is the
biased one. E90 established that drive_cold penalises every added element; of course its
promoted region is binaries. Using it to design the calibration set would bake that bias into
the proxy. The unbiased choice would be the effective driving force of E91, and that contains
the Q estimate under repair, so selecting with it is circular.
There is no clean answer to this while the objective is in flux, and the design that
follows is a compromise stated as one: sample the low-misfit, few-element region densely
because that is where Q is asked today, and keep the wide spread that spans Q from 0.63 to
5.34 eV because it is what constrains the functional form and because the promoted region
will widen if the effective objective survives. The survey as originally designed has the
second half and not the first.