Does a map of 219 alloys reproduce the published trends in ordering temperature?
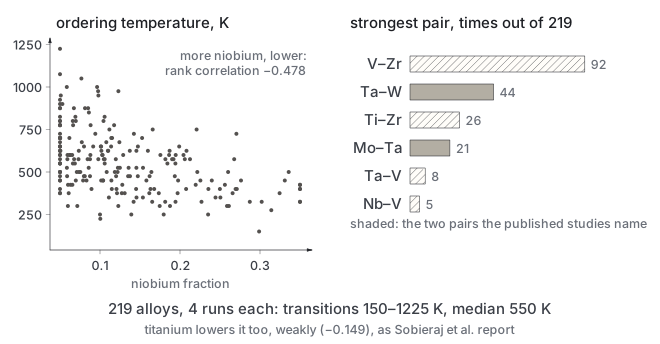
Partly. Titanium lowers it, as published, but weakly (rank correlation −0.149); niobium lowers it most (−0.478); temperatures span 150–1225 K.
In the log: A short-range-order and transition-temperature map, and it reproduces a trend
recordedDate 2026-09-13, as written in the logunclassified0 predictions · 0 result paragraphsEXPERIMENTS.md lines 2280–2335
What E45 did and how it came out, drawn from this record and the files it names (book/assets/diagrams/exp/E45.svg).
Results
No result paragraph for this entry was found in the log.
The full record
EXPERIMENTS.md · lines 2280–2335
E45 — A short-range-order and transition-temperature map, and it reproduces a trend
Date 2026-09-13 · Question The deliverable is where these alloys order and at what
temperature. What does the design space look like? · Provenancescripts/odt_map.py,
runs/odt_map/map.jsonl
219 compositions, each with four independent Monte Carlo runs down an 18-point ladder
from 1800 K at 128 sites, across the bounded design space of section 4f-bis. Roughly ninety
seconds each, run overnight on this machine at no cost.
The spread. Transitions from 150 to 1225 K, median 550, with one composition at a
ladder edge - so the range covers the space. Short-range-order strength 0.68 to 1.71,
median 1.14. That the transition swings by a factor of eight across compositions is
consistent with Sobieraj et al., who report 300 to 1400 K across theirs.
Which pairs order, across the whole space:
pair
times dominant
mean alpha
V-Zr
92
-2.79
Ta-W
44
-3.28
Ti-Zr
26
-3.00
Mo-Ta
21
-2.43
Ta-V
8
-2.59
Nb-V
5
-2.50
Ta-W and Mo-Ta are precisely the pairs the two independent papers identify - Sobieraj et
al. flag Ta-W as one of the two most influential in Cr-Ta-Ti-V-W, Nguyen-Manh et al. find
Mo-Ta strongest in MoNbTaVW. Both emerge here without being sought.
Element trends, and one is a reproduction.
element
Spearman with transition
Nb
-0.478
lowers it, decisively (p < 1e-12)
Ti
-0.149
lowers it, marginally (p ~ 0.03)
Zr
+0.238
raises it (p ~ 4e-4)
V
+0.228
raises it
Hf
+0.170
raises it
Ta, W
+0.00
no detectable effect
Sobieraj et al. report that increasing titanium significantly decreases the
order-disorder temperature. The same sign appears here across 219 compositions from an
expansion never fitted to their data - though at p ~ 0.03 it is a weak reproduction, and is
reported as such rather than as agreement.
New, and not in either published system.V-Zr dominates more often than any other
pair and niobium lowers the transition more strongly than titanium does. Neither
Cr-Ta-Ti-V-W nor MoNbTaVW contains zirconium, so neither could have seen the first; and
Nb's effect is three times titanium's here.
The limitation, stated with the result. Each individual transition carries +/- 173
K (median across four runs) - the Monte Carlo scatter established in E41, which more
training data cannot reduce. The trends over 219 compositions are far better determined
than any single entry, and only the trends should be quoted. Individual compositions in
this map are candidates for a careful determination, not determinations themselves.
Related entries
E41 — The transition temperature does not converge with data, and E39 over-read one run