EXPERIMENTS.md · lines 1801–1851E36 — The smearing curve, derived rather than sampled: it is monotone
Date 2026-09-12 · Question E34 estimated the interpolation path by sampling and
reported 1 to 6 turning points on some pairs. Is that structure, or noise? ·
Provenance …/{derive,smear_exact}.py
Operator's standing instruction, applied here: derive it, do not approximate it. The
quantity has a closed form and the sampling was where the errors were.
The derivation. A cluster expansion is a sum over clusters of products of one-site
functions, and the sites within a cluster are distinct. Under independent site occupations
the expectation of a product over distinct sites factorises, so
<E>(t) = sum_j C(n,j) t^j (1-t)^(n-j) A_j , A_j = mean energy over subsets of size j
is exact, and because every cluster touches at most three sites, each contributing a
factor linear in t, <E>(t) is a cubic in t whatever n is. Verified symbolically: pair
clusters give degree 2, triplets degree 3, t = 0 recovers the all-x cluster and t = 1 the
all-y one. Enumerating 8 interpolating sites costs 256 evaluations and carries no sampling
error at all.
It also dissolves the bug that took two attempts to find. The first version sampled
sites independently and did not preserve composition, so it measured composition
fluctuation - thousands of meV/atom for a ten-meV quantity. The exact expectation has no
such problem, because an expectation is not a sample.
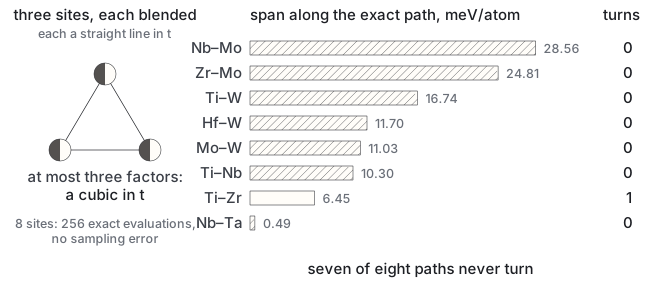
Result, exact:
meV/atom. Seven of eight paths are monotone, the eighth turning once, and every
group 4-to-6 pair is monotone. Separation in the periodic table correlates with the span
(+0.69) and weakly with departure from a straight line (+0.44).
Supersedes E34's turning points. Those counts - 1, 3, 5 and 6 on various pairs - were
sampling noise; the underlying curves have none. E34's conclusion is unchanged and
strengthened: interpolating between elements smooths this landscape, and it does so across
the full group 4-to-6 span, not only between periodic-table neighbours as the published
demonstrations showed. The concern raised against the operator's proposal is wrong on the
exact arithmetic as well as the approximate.
Note (2026-09-24 00:20, from the final site check): E36's spans are not comparable with E34's, and the tables differ by up to ten times (Zr–Mo 24.81 here, 2.3 in E34). On a monotone path the span is the energy difference between its two end arrangements; a sampled path's span can only be larger. So the two entries cannot have used the same end arrangements. The likely cause is that each script drew its own, but both scripts were in /tmp and are gone, so that is inferred, not shown. What E36 supersedes is the turning-point counts; its spans stand on their own and are the ones quoted on the site.