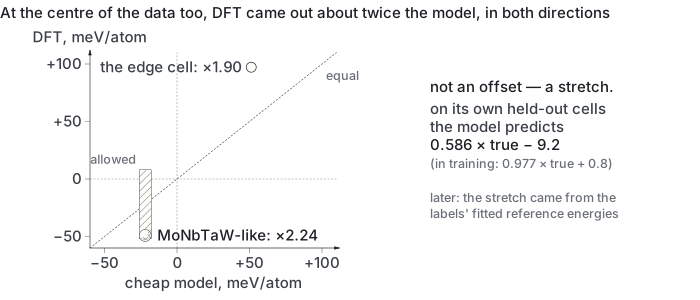
At the centre of its training data, does the cheap model agree with DFT?
Yes. DFT gave −49.1 meV/atom against −21.9, inside the allowed band; the factor-two gap was later traced to the labels' reference energies.
In the log: the second rung-4 verdict: a refractory-centred cell
confirmedDate not stated in the log; it was written between the commit of 2026-09-16 19:06 and the first commit that contains it, 2026-09-19 08:35rung 4 · DFT1 prediction · 1 result paragraphEXPERIMENTS.md lines 11305–11329, lines 11331–11361
What E176 did and how it came out, drawn from this record and the files it names (book/assets/diagrams/exp/E176.svg).
Pre-registration
(46)
, the error is not "thin data at
the edge" but something systematic between the eCE's labels and QE-vs-QE formation
energies — and E175's per-source offset becomes the first suspect, not the last.
2. Converges in < 40 iterations under local-TF β 0.1 (E172 took 25 with eight species;
four species should be no harder).
3. Together with E172 this gives the first two points of the flywheel's calibration:
if E172 is +46 off and E176 within ±10, the eCE's error is composition-dependent and
the refit should be weighted toward the edge; if both are off by a similar signed amount,
a code offset (per-source term) explains both and E175 should absorb it.
no verdict written against it
The pre-registration, as written
E176 — the second rung-4 verdict: a refractory-centred cell
E172 fell at the thin edge of the data (Hf/Zr-rich). The obvious second point is the data's
centre: Mo₁₄Nb₁₄Ta₁₃W₁₃, a random decoration (seed 0) on 54 ideal bcc sites, Vegard
a = 3.2554 Å (L = 9.7663 Å), the same settings as E172 (50/400 Ry, MV 0.02 Ry, 3×3×3,
local-TF β 0.1, mpirun -np 8 -nk 2), single SCF at Vegard — E172's prediction 2 showed
the volume correction is 0.02 meV/atom for a cell of this kind, so no volume scan.
References: Mo, Nb, Ta, W from refs_v2/ (same settings; k-spacing 0.212 Å⁻¹ vs this
cell's 0.214 — a 1% difference that the two-atom cells at k = 10 do not resolve).
The cheap rung's number, before DFT: eCE E_lattice = −21.9 meV/atom (mapping cost
4e-20). Favourable, as MoNbTaW is known to be.
Predictions.
E_form(DFT) is within 2 × RMSE = 30 meV of −21.9, i.e. in [−52, +8], and negative.
This is the region RHEA samples densely and where the eCE's holdout error was measured;
if the eCE misses here by as much as it missed E172 (46), the error is not "thin data at
the edge" but something systematic between the eCE's labels and QE-vs-QE formation
energies — and E175's per-source offset becomes the first suspect, not the last.
Converges in < 40 iterations under local-TF β 0.1 (E172 took 25 with eight species;
four species should be no harder).
Together with E172 this gives the first two points of the flywheel's calibration:
if E172 is +46 off and E176 within ±10, the eCE's error is composition-dependent and
the refit should be weighted toward the edge; if both are off by a similar signed amount,
a code offset (per-source term) explains both and E175 should absorb it.
Results
EXPERIMENTS.md · line 11331
E176 result — prediction 1 confirmed at the edge of its window, and the two cells together
say something neither prediction 3 case named. JOB DONE in 21 iterations (prediction 2
confirmed). E/atom −7334.68128 eV at Vegard; references Mo/Nb/Ta/W from refs_v2/:
E_form(DFT) = −49.1 meV/atom vs eCE −21.9, difference −27.2 — inside [−52, +8] by 3 meV,
negative as predicted. Across the two cells:
Not an offset (the misses have opposite signs) — a scale: DFT is about twice the eCE in
both directions. Prediction 3 offered "edge effect" or "code offset"; it is neither, and I
record that its two cases were not exhaustive. The eCE's own holdout says the same thing
once asked the right question: on the 159 held-out compositions predicted = 0.586 × true
− 9.2 (r = 0.76), against 0.977 × true + 0.8 (r = 0.98) in-sample. The model compresses
formation energies of compositions it has not seen by ~40%; the MAE (11.4) hid it because
most held-out energies are small. Two QE cells at 1.9–2.2× are that compression seen from
outside, plus whatever QE-vs-VASP adds — which the ACWF numbers say is small.
What this changes. The rung-0 driving force for a new composition — the quantity the
search rewards — is understated by roughly 0.6×; finds are being under-paid and thresholds
(p ≥ 0.832 on a −40 meV drive) are being applied to a shrunken scale. The flywheel's target
is therefore the holdout slope, not the holdout MAE: E175's refit is re-scoped to
measure slope on the composition-wise holdout before and after adding the QE cells with the
per-source term, with the prediction that two cells move the slope by < 0.02 (two points
among 4,300 cannot) — which makes the honest statement that the flywheel needs tens of
rung-4 cells at new compositions, ~1 h each, before it can change the cheap rung's
scale, and that the cells should be chosen at the search's own finds, where the
understatement matters. Until then, a provisional correction — dividing the eCE's E_form by
0.586 for compositions outside the training support — is a hypothesis to test on the next
cell, not a fix to apply.
The full record
This entry is written in 2 separate places in the log, shown here in log order.
EXPERIMENTS.md · lines 11305–11329
E176 — the second rung-4 verdict: a refractory-centred cell
E172 fell at the thin edge of the data (Hf/Zr-rich). The obvious second point is the data's
centre: Mo₁₄Nb₁₄Ta₁₃W₁₃, a random decoration (seed 0) on 54 ideal bcc sites, Vegard
a = 3.2554 Å (L = 9.7663 Å), the same settings as E172 (50/400 Ry, MV 0.02 Ry, 3×3×3,
local-TF β 0.1, mpirun -np 8 -nk 2), single SCF at Vegard — E172's prediction 2 showed
the volume correction is 0.02 meV/atom for a cell of this kind, so no volume scan.
References: Mo, Nb, Ta, W from refs_v2/ (same settings; k-spacing 0.212 Å⁻¹ vs this
cell's 0.214 — a 1% difference that the two-atom cells at k = 10 do not resolve).
The cheap rung's number, before DFT: eCE E_lattice = −21.9 meV/atom (mapping cost
4e-20). Favourable, as MoNbTaW is known to be.
Predictions.
E_form(DFT) is within 2 × RMSE = 30 meV of −21.9, i.e. in [−52, +8], and negative.
This is the region RHEA samples densely and where the eCE's holdout error was measured;
if the eCE misses here by as much as it missed E172 (46), the error is not "thin data at
the edge" but something systematic between the eCE's labels and QE-vs-QE formation
energies — and E175's per-source offset becomes the first suspect, not the last.
Converges in < 40 iterations under local-TF β 0.1 (E172 took 25 with eight species;
four species should be no harder).
Together with E172 this gives the first two points of the flywheel's calibration:
if E172 is +46 off and E176 within ±10, the eCE's error is composition-dependent and
the refit should be weighted toward the edge; if both are off by a similar signed amount,
a code offset (per-source term) explains both and E175 should absorb it.
EXPERIMENTS.md · lines 11331–11361
E176 result — prediction 1 confirmed at the edge of its window, and the two cells together
say something neither prediction 3 case named. JOB DONE in 21 iterations (prediction 2
confirmed). E/atom −7334.68128 eV at Vegard; references Mo/Nb/Ta/W from refs_v2/:
E_form(DFT) = −49.1 meV/atom vs eCE −21.9, difference −27.2 — inside [−52, +8] by 3 meV,
negative as predicted. Across the two cells:
Not an offset (the misses have opposite signs) — a scale: DFT is about twice the eCE in
both directions. Prediction 3 offered "edge effect" or "code offset"; it is neither, and I
record that its two cases were not exhaustive. The eCE's own holdout says the same thing
once asked the right question: on the 159 held-out compositions predicted = 0.586 × true
− 9.2 (r = 0.76), against 0.977 × true + 0.8 (r = 0.98) in-sample. The model compresses
formation energies of compositions it has not seen by ~40%; the MAE (11.4) hid it because
most held-out energies are small. Two QE cells at 1.9–2.2× are that compression seen from
outside, plus whatever QE-vs-VASP adds — which the ACWF numbers say is small.
What this changes. The rung-0 driving force for a new composition — the quantity the
search rewards — is understated by roughly 0.6×; finds are being under-paid and thresholds
(p ≥ 0.832 on a −40 meV drive) are being applied to a shrunken scale. The flywheel's target
is therefore the holdout slope, not the holdout MAE: E175's refit is re-scoped to
measure slope on the composition-wise holdout before and after adding the QE cells with the
per-source term, with the prediction that two cells move the slope by < 0.02 (two points
among 4,300 cannot) — which makes the honest statement that the flywheel needs tens of
rung-4 cells at new compositions, ~1 h each, before it can change the cheap rung's
scale, and that the cells should be chosen at the search's own finds, where the
understatement matters. Until then, a provisional correction — dividing the eCE's E_form by
0.586 for compositions outside the training support — is a hypothesis to test on the next
cell, not a fix to apply.
Related entries
E172 — the first rung-4 verdict: DFT vs the cheap rung on one 54-atom cell