Are the corrected labels real signal, or mostly the correction's own error?
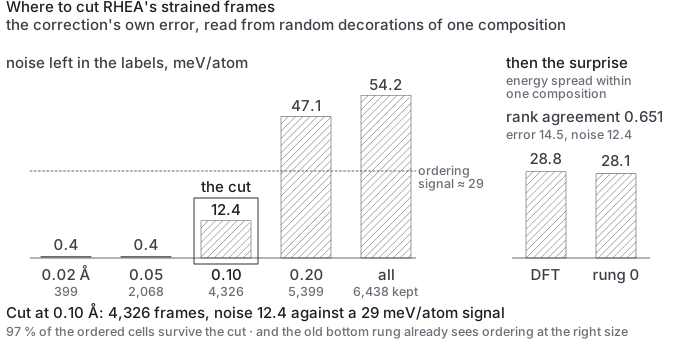
Partly. Below 0.10 Å of strain they are usable: noise 12.4 meV/atom against a 29 meV/atom ordering signal.
In the log: Is the corrected label a label, or is it the correction's error?
mixedDate not stated in the log; it was written between the commit of 2026-09-16 19:06 and the first commit that contains it, 2026-09-19 08:35rung 4 · DFT3 predictions · 7 result paragraphsEXPERIMENTS.md lines 9162–9209, lines 9715–9750, lines 9768–9796, lines 9798–9824, lines 9826–9859, lines 9861–9905, lines 9907–9929, lines 9931–9964, lines 9966–10011, lines 10584–10597
What E151 did and how it came out, drawn from this record and the files it names (book/assets/diagrams/exp/E151.svg).
Pre-registration
(1)
its within-composition rank correlation with DFT
is below 0.3;
no verdict written against it
(2)
its |dE| scale is under a third of DFT's (DFT's is ~29 meV/atom
here) — the "too flat" reading of E150's interim, now on labels that can support it;
no verdict written against it
(3)
had bcc cells inside bcc_binary_alloys:
Hf: MACE minimum 3.527 A vs DFT's lowest raw cell at 3.600, -0.073 A — outside 0.03,
but Hf was the element I said would be undefined, since its bcc "minimum" is the
instability; Ti: -0.005 A, inside 0.01. The test's actual target, Cr, is pending a label
pass over pure_elem_lowE (launched now, ~105 cubic cells).
The P1 training file.runs/rhea_labels_formation_strain0.10.jsonl: 4,326 frames,
formation energies mean 0.0, sd 63.4, range -305 to +189 meV/atom, references
Cr -9.243, Hf -12.406, Mo -11.045, Nb -10.185, Ta -11.766, Ti -7.703, V -8.895, W -12.950,
Zr -8.183 eV/atom (within 5 meV of the cut-400/800 values, as the non-tail mechanism
requires).
P2 baseline, predicted before it runs. Scoring ce_12element — the current bottom rung,
fitted to MACE labels on random cells, never shown an ordered cell — on these labels, within
composition where every offset cancels
no verdict written against it
The pre-registration, as written
E151, three closures.
The eleven non-finite frames are the +6.5 eV tail. Three 128-atom ordered cells and eight
54-atom random ones have a_relaxed = NaN and corrections of -4.2 to -6.6 eV/atom — MACE
returned non-finite energies somewhere in their volume scans (input lattice constants 3.06 to
3.76 A, the expanded end), the parabola fit propagated it, and E_lattice = E_DFT - (-6 eV)
became the +6,534 meV/atom maximum E150's prediction 1 was falsified on. So that tail was
eleven broken frames, not a strained population; the strain cut and an isfinite guard in
the reference pass both exclude them. E150 prediction 1 stands falsified on the sd (259)
but its "max +6,534" was a bug, not a distribution.
The Cr-volume test cannot run as pre-registered. The label pass covered the three alloy
groups; the pure-element cubic cells for Cr, Mo, Nb, Ta, V and W sit in pure_elem_lowE,
which it skipped. Only Hf (12 frames) and Ti (3) had bcc cells inside bcc_binary_alloys:
Hf: MACE minimum 3.527 A vs DFT's lowest raw cell at 3.600, -0.073 A — outside 0.03,
but Hf was the element I said would be undefined, since its bcc "minimum" is the
instability; Ti: -0.005 A, inside 0.01. The test's actual target, Cr, is pending a label
pass over pure_elem_lowE (launched now, ~105 cubic cells).
The P1 training file.runs/rhea_labels_formation_strain0.10.jsonl: 4,326 frames,
formation energies mean 0.0, sd 63.4, range -305 to +189 meV/atom, references
Cr -9.243, Hf -12.406, Mo -11.045, Nb -10.185, Ta -11.766, Ti -7.703, V -8.895, W -12.950,
Zr -8.183 eV/atom (within 5 meV of the cut-400/800 values, as the non-tail mechanism
requires).
P2 baseline, predicted before it runs. Scoring ce_12element — the current bottom rung,
fitted to MACE labels on random cells, never shown an ordered cell — on these labels, within
composition where every offset cancels: (1) its within-composition rank correlation with DFT
is below 0.3; (2) its |dE| scale is under a third of DFT's (DFT's is ~29 meV/atom
here) — the "too flat" reading of E150's interim, now on labels that can support it;
(3) MACE-MPA-0 on the same structures ranks better than the expansion (rho above 0.5),
since it at least saw ordered intermetallics in training. Falsified if the expansion's
rho/comp exceeds 0.6, which would mean it resolves ordering it was never trained on and the
case for replacing it weakens to a cost argument.
E151 follow-up — references from corrected pure cells, done.--pure-references holds
Cr, Mo, Nb, Ta, V, W at the lowest corrected pure bcc cell from the pure_elem_lowE pass
and regresses only Hf, Ti, Zr on the remainder:
Cr -9.5084   Mo -10.9154   Nb -10.2122   Ta -11.7940   V -8.9864   W -12.9257   (measured)
Hf -12.3721  Ti -7.6645    Zr -8.1505                                            (fitted)

formation energy, 4,326 frames at the 0.10 A cut:  mean +17.2  sd 83.1  min -270  max +324 meV/atom
The mean is no longer zero by construction — a set of real bcc formation energies has a
mean, and this one is positive because the equation-of-state sets sample unfavourable
mixtures on purpose. This file, rhea_labels_formation_strain0.10_pureref.jsonl, is the one
a hull is built from. Ordering energies are unchanged by a per-element shift; the eCE
training file need not be rebuilt for P1, only for any formation-energy use.
Results
EXPERIMENTS.md · line 9715
E151 result — the label gate, on all 6,449 corrected frames. Prediction 1 falsified;
the labels are not usable as-is, and the reason is the strained tail, not the correction.
|correction|: median 61, p90 726, max 6,580 meV/atom

1. residual volume dependence, within composition (100 compositions, >=4 frames, >0.05 A)
     |dE/da| before   1,962 meV/atom per A
     |dE/da| after      314 meV/atom per A      84.0% removed
     over 0.1 A          31.4 meV/atom          gate was 15  ->  NOT usable as-is

3. within-composition spread against correction size
     |corr| < 100    3,806 frames   mean |dE|  29.3
     |corr| < 200    4,603          28.8
     |corr| < 400    5,277          28.1
     |corr| < 800    5,878          31.4
     all             6,449          44.4
Prediction 1 falsified: 84% removed and 31.4 meV/atom residual, against ">90%" and
"under 15". Not the abandon-the-correction branch either — I set that at a residual above 30%
of the uncorrected slope, and it is 16%.
Prediction 2 resolved toward physics, which is the outcome I said would be the more
interesting one. The spread sits at 28-31 meV/atom for every cut up to 800 and only
rises to 44 when the 571 heaviest-corrected frames are admitted. A spread that does not move
across a factor-of-eight range of correction size is not correction error. It is the energy
difference between ordered and random configurations at one composition — the
bcc_alloys_ordered 16-atom cells against the 54-atom solid solutions sharing a composition
key — and ~29 meV/atom is the textbook scale of a bcc refractory ordering energy. This is
the quantity the ladder's bottom rung exists to resolve, measured directly from DFT for the
first time in this project. Whether the current expansion reproduces it is the P2 scoring
on this set, not yet run on the full labels; the interim "x45 too flat" of E150 was measured
on random-only binaries where the true spread is small and the correction error was not, and
is withdrawn as a comparison.
Prediction 3 confirmed: a strain cut is required, and the tail it removes is where
bcc_binary_alloys samples the equation of state on purpose.
EXPERIMENTS.md · line 9768
E151, the cut sweep — and the gate quantity fails as a cut-selector. Diagnostic 1 at
increasing strain cuts (|correction| in meV/atom, --skip-direct):
Non-monotonic, and the tightest cut is the worst. That is not the labels; it is the metric.
Diagnostic 1 fits a linear slope of E_lattice against a_in within a composition. Under
a tight cut the surviving frames are the ones already near their own equilibrium, where
E(a) is quadratic and nearly flat and the span of a_in is narrow, so a straight line
through them measures curvature and fitting noise, not a residual volume dependence — and
the "removed %" shrinks because the before slope is small there too, not because the
correction got worse. The pre-registered gate quantity is a sound test for "did the
correction do anything" on the full set, and an unsound one for choosing where to cut. I
stated it as the decisive diagnostic; as a selector it is withdrawn.
What is robust in the table: 400 and 800 sit on a plateau at ~18, and the jump to 31 is the
800 tail — the same 571 frames diagnostic 3 identifies as where correction error enters.
Replacement, stated before it is run: within composition, regress E_lattice on the
signed input strain d = a_in - a_relaxed and report slope x median|d| — the label's
remaining dependence on how strained the input frame was, which is what the correction was
supposed to remove and which does not conflate with the physical curvature of E(a). Predicted:
monotone in the cut, under 15 meV/atom by cut 800, and the reference-gap sign split (Cr, Hf, V
fitted above raw cells) closes at the same cut.
EXPERIMENTS.md · line 9798
E151, diagnostic 1b — my replacement is falsified by the same mechanism, and the mechanism
is now identified. Residual over a typical frame, regressing the label on input strain
a_in - a_relaxed within composition:
I predicted monotone and under 15 by cut 800. It is neither. Tighter cuts are worse again,
and the arithmetic says why: at cut 100 a residual of 79 over a median strain of ~0.03 A
means a fitted slope near 2,600 meV/atom per A, which no correction error produces. What
produces it is the ~29 meV/atom ordered-versus-random spread measured in diagnostic 3 —
physics, uncorrelated with strain — divided by a strain span of a few hundredths of an
angstrom. Whenever 16-atom ordered cells share a composition key with 54-atom random cells,
any within-composition regression on a narrow span reads the configuration effect as a
strain slope. Diagnostic 1 had the same contamination and hid it under the curvature story.
The separation the diagnostics need: restrict the strain test to the random groups
(bcc_alloys, bcc_binary_alloys). At one composition, random 54-atom decorations have
nearly identical cluster vectors and therefore nearly identical energies — that is the
literature result E149 rests on — so their residual variation is strain or correction
error, with no configuration term to confuse it. The ordered cells are also the lightly
corrected ones (Fable measured -46 +/- 12 meV/atom of rattle on them), so the strain question
was always about the equation-of-state sets. Predicted, before running: on random-only groups
the residual is monotone in the cut and under 15 meV/atom by cut 400.
EXPERIMENTS.md · line 9826
E151, diagnostic 1b on random groups only — falsified a third time, and the reason is
structural.
Restricting to random groups removes the absurd slopes — 79 becomes 21 at the best cut — so
the mechanism named above was right. But "monotone and under 15 by 400" is wrong: 400 is a
minimum at 20.9, and tightening past it does not lower the residual, it removes the test
set, because the strained equation-of-state frames are both what tests the correction and
what the cut discards. A cut on |correction| cannot be selected by this diagnostic, on
principle, not just on these numbers.
What is measured and stands: at the plateau, the correction leaves ~21 meV/atom of
strain-correlated error on a typical random EOS frame — MACE's relative accuracy over a
few-hundred-meV bridge is 5-8%, and 5-8% of that bridge is the size of the ordering signal.
By the same slope an ordered cell at its typical ~0.03 A of input strain carries ~6 meV/atom.
The contamination is concentrated in the frames that carry the least ordering information.
Reframed, with a prediction before the measurement. Cut on the input strain
|a_in - a_relaxed| itself, not on the correction, and judge the cut by the cleanest noise
estimate available: the within-composition sd among random decorations, which by the
cluster-vector argument have almost no physical spread, so their post-correction spread is
correction error and nothing else. Predicted: that sd is under 10 meV/atom at
|strain| <= 0.05 A and rises monotonically with the cut; at least 80% of the
bcc_alloys_ordered cells survive a 0.05 A cut (they were rattled, not strained); and the
random EOS frames beyond 0.10 A are where the sd exceeds 20. Falsified if the sd among random
decorations is already above 15 at 0.05 A — then the residual is not strain-correlated at all
and the correction is noisy even where it has little to do, which would send this back to the
label pipeline rather than to a cut.
EXPERIMENTS.md · line 9861
E151, diagnostic 2 under the cut — the sign split does not close, and my prediction that
it would is falsified. Reference gaps (fitted minus raw direct, meV/atom):
el     none    cut 400   cut 800
Cr     -223    -200      -195
Hf     -137    -106       -97
Mo     +207    +194      +193
Nb      +98     +28       +40
Ta      +71     +22       +27
Ti       +4     +12        +6
V       -53     -52       -42
W       +165    +116      +129
sd       139     115       115
Nb, Ta, W and Ti tighten with the cut, as a strained-tail leak would. Cr, Mo, Hf and V do
not move. So the tail was part of it and the rest is something a strain cut cannot reach,
and the elements name it:
Hf, and to a lesser extent Ti and Zr: physics. Group-IV bcc is dynamically unstable at
0 K. A rattled bcc Hf cell is not a noisy version of the ideal one, it is partway down a real
instability, so its raw energy sits below the ideal-lattice reference. A fitted reference
above a raw cell is exactly what should happen for Hf. This is the blind spot already
recorded against every bcc cluster expansion in this project, appearing in the references.
Cr, and probably V: the convention sits at MACE's volume, not DFT's.E_lattice is the
energy of the ideal configuration at the volume MACE relaxes it to. Where MACE's
equation-of-state minimum is displaced from PBE's, every frame containing that element
carries an offset proportional to its fraction — a composition-dependent shift, which is
precisely the linear-in-composition term the regression puts into the reference. RHEA is
non-spin-polarised and MACE-MPA-0 was trained on a Materials Project chromium that is not,
so Cr is the element where the two equilibria are least likely to agree.
Mo +194 and W +193 persist too and are not group IV; they are the largest positive gaps,
consistent with the same volume mismatch in the other direction.
What this does and does not cost. A per-element volume offset is absorbed exactly by a
cluster expansion's singlet terms and cancels in any energy difference at fixed composition.
It does not touch ordering energies, which is what the ladder's bottom rung is for. It does
shift formation energies and therefore the hull, so the hull must not be built from these
labels without the offset measured.
Pre-registered test of the Cr mechanism. For pure-element frames the label file records
a_in (RHEA's cell) and a_relaxed (MACE's minimum). Take, per element, the a_in of the
lowest-energy raw cubic cell as the PBE equilibrium and compare it with MACE's a_relaxed
for the same frames. Predicted: Cr differs by more than 0.03 A; Mo, Nb, Ta, W within
0.01 A; Hf and Ti undefined in the sense that their bcc minimum is not a minimum. If Cr
agrees with DFT to 0.01 A the mechanism is wrong and the Cr offset is unexplained.
EXPERIMENTS.md · line 9907
E151 result — the cut, chosen by the noise among random decorations.
|strain| <=   kept   random  ordered (kept%)   testable comps   sd among random decorations   max |corr|
0.02 A         399     215      184   ( 7%)          1                 0.4                        170
0.05 A       2,068     835    1,233   (46%)          1                 0.4                        198
0.10 A       4,326   1,708    2,618   (97%)         14                12.4                        327
0.20 A       5,399   2,711    2,688  (100%)        132                47.1                      1,162
all          6,438   3,750    2,688  (100%)        703                54.2                      4,537
Monotone: confirmed. The spread among random decorations of one composition — which have
almost no physical spread, so this is correction error — rises 0.4 → 12.4 → 47 → 54 with the
strain admitted. "At least 80% of ordered cells survive 0.05 A": falsified, 46%. The
ordered cells are more strained relative to MACE's minimum than "rattled, not strained"
implied. "Under 10 at 0.05 A": unassessable, one testable composition.
The cut is 0.10 A. It keeps 4,326 frames including 97% of the ordered cells, caps the
correction at 327 meV/atom, and leaves a label noise floor of 12.4 meV/atom against the
29 meV/atom ordering spread of diagnostic 3 — about 2:1 per structure, which a fit over
thousands of structures averages down and which is stated here so nobody reads the training
loss as the label accuracy. Past 0.10 A the error is ~50 meV/atom and would swamp the signal;
the frames it removes are the equation-of-state sets, not the ordered ones.
Eleven frames fall out of "all" (6,438 of 6,449): their strain is non-finite. Checked below.
EXPERIMENTS.md · line 9966
E151, P2 baseline — my prediction is falsified on every count, and the falsification is
the most important number of the day.ce_12element and MACE-MPA-0 scored within
composition on the 0.10 A labels (212 compositions with >= 3 configurations, 2,292 structures):
model           MAE dE   rho pooled   rho/comp   |dE| DFT   |dE| model
ce_12element     14.5      0.847        0.651      28.8       28.1
MACE-MPA-0       12.0      0.895        0.671      28.8       28.9
label noise floor (E151)                                       12.4
(1) "rho/comp below 0.3": 0.651. (2) "|dE| under a third of DFT's": 28.1 against 28.8
— the scale is right to 2%. (3) "MACE ranks better": true by 0.02, which is nothing. The
falsification condition I set — rho/comp above 0.6 — is met. The current bottom rung
resolves ordering energies it was never shown, at the right magnitude, and its 14.5 meV/atom
error is at the 12.4 meV/atom noise floor of the labels themselves. On this set it cannot
be told apart from a perfect model, and neither can MACE.
Withdrawn:E150's interim "the expansion is 45x too flat" and E151's "17x" — both were
measured on random-only binaries where the DFT spread was correction error, not physics. The
expansion's spread matches DFT's once the labels are clean. The case for the eCE is not
within-distribution ordering accuracy; it is extrapolation into withheld chemistry and cost
per element, which is what the paper claims and what P2's MoNbTaW/MoNbTaVW holdout tests.
Cr-volume test — falsified, informatively. MACE's bcc minimum sits above DFT's lowest raw
cell for all six elements, not Cr alone: Cr +0.057, Mo +0.035, Nb +0.030, Ta +0.050,
V +0.041, W +0.037 A. A uniform ~1% offset is worth tens of meV and has one sign; it cannot
make Cr -200 against Mo +190.
The two-route reference comparison, redone in one convention — fitted references at the
0.10 A cut against the lowest corrected pure cell from the pure_elem_lowE pass:
Cr +265 Mo -129 V +91 Nb +27 Ta +28 W -25 meV/atom (fitted minus pure)
Still scattered, and pure Cr cells needed only 63 meV/atom of correction, so this is not the
correction either. The mechanism, and the one I recorded in memory and on the plan page
is withdrawn: a composition-linear regression over alloys does not recover elemental
energies. Its intercepts are "elemental energy plus the mean mixing slope along that
element's direction", and with five pure-Cr frames against thousands of Cr-containing alloys
the Cr column is set by the alloys. That is a property of regression intercepts, not of
MACE's volume. The right references are the corrected pure cells where they exist (six
elements) with only Hf, Ti and Zr fitted — a follow-up for the hull, since a per-element
constant is absorbed exactly by any expansion's point terms and does not touch ordering.
P1 died on my bug.train_ece.py wrote each m x m x m supercell's fractional coordinates
into a 1 x 1 x 1 cell — 54 atoms in a 3.29 A cube — and pyeCE rejected all 4,326 structures
as "lattice deformation too large". ideal_frac_of returns m; emit discarded it. Fixed;
relaunched to a fresh directory.
The full record
This entry is written in 10 separate places in the log, shown here in log order.
EXPERIMENTS.md · lines 9162–9209
E151 — Is the corrected label a label, or is it the correction's error?
E150 removes displacement and volume energy with one MACE difference per structure. On the
first 529 frames that correction has a median magnitude of 657 meV/atom and reaches 2,941.
The ordering signal is 10-30 meV/atom. So the whole pipeline rests on a quantity nobody has
measured: MACE's relative accuracy on a correction of that size. At 1% it is fine. At 5% the
labels carry 33 meV/atom of noise and the exercise is pointless.
E78's 1-4 meV/atom was measured on small differences. It does not transfer to these.
The first symptom is already visible. Scoring ce_12element on the partial labels, the
within-composition energy spread is 76.3 meV/atom in the corrected DFT and 1.7 meV/atom in
the expansion — a factor of 45. Either the expansion is far too flat, or most of that 76 is
correction error, or both. The scorer cannot tell those apart and neither can a validation
curve.
The test that can. A correct volume correction has one signature that cannot be faked:
after it, the label must not depend on the input lattice constant. RHEA samples the same
composition at many lattice constants, so within a composition the residual slope
dE_lattice/da_in is a direct read of what the correction failed to remove. Three diagnostics,
run together as the gate on E150:
residual |dE/da| within composition, against the same slope before correction;
the eight elemental references that can be read directly from RHEA's own bcc cells, against
the nine fitted by regression;
the within-composition spread as a function of correction size — if the spread is correction
error it shrinks when restricted to small-correction frames, and if it is physics it does
not.
Predicted:
The correction removes more than 90% of the volume dependence, leaving under
~15 meV/atom across a typical 0.1 Å spread. Below that the labels are usable; above it they
are not, whatever the training loss says.
The within-composition spread falls with correction size — the frames needing under
200 meV/atom of correction will show a spread well below the pooled 76 meV/atom. If it does
not fall, the 76 is physics and the expansion really is 45 times too flat, which is a far
more interesting result and would be the strongest argument yet for replacing it.
A strain cut will be necessary, keeping frames whose input lattice constant is within
~0.05 Å of relaxed, and it will cost a large fraction of bcc_binary_alloys, which is an
equation-of-state set sampled far from equilibrium on purpose.
Falsified if the residual slope stays above ~30% of the uncorrected one, which would mean
MACE cannot bridge these volumes and the honest move is to abandon the correction and train on
near-equilibrium frames only — fewer structures, but labels that mean something.
Deliberately not assumed: prediction 2 has two outcomes and both are informative, so this
is not a check being run to confirm something already believed.
EXPERIMENTS.md · lines 9715–9750
E151 result — the label gate, on all 6,449 corrected frames. Prediction 1 falsified;
the labels are not usable as-is, and the reason is the strained tail, not the correction.
|correction|: median 61, p90 726, max 6,580 meV/atom

1. residual volume dependence, within composition (100 compositions, >=4 frames, >0.05 A)
     |dE/da| before   1,962 meV/atom per A
     |dE/da| after      314 meV/atom per A      84.0% removed
     over 0.1 A          31.4 meV/atom          gate was 15  ->  NOT usable as-is

3. within-composition spread against correction size
     |corr| < 100    3,806 frames   mean |dE|  29.3
     |corr| < 200    4,603          28.8
     |corr| < 400    5,277          28.1
     |corr| < 800    5,878          31.4
     all             6,449          44.4
Prediction 1 falsified: 84% removed and 31.4 meV/atom residual, against ">90%" and
"under 15". Not the abandon-the-correction branch either — I set that at a residual above 30%
of the uncorrected slope, and it is 16%.
Prediction 2 resolved toward physics, which is the outcome I said would be the more
interesting one. The spread sits at 28-31 meV/atom for every cut up to 800 and only
rises to 44 when the 571 heaviest-corrected frames are admitted. A spread that does not move
across a factor-of-eight range of correction size is not correction error. It is the energy
difference between ordered and random configurations at one composition — the
bcc_alloys_ordered 16-atom cells against the 54-atom solid solutions sharing a composition
key — and ~29 meV/atom is the textbook scale of a bcc refractory ordering energy. This is
the quantity the ladder's bottom rung exists to resolve, measured directly from DFT for the
first time in this project. Whether the current expansion reproduces it is the P2 scoring
on this set, not yet run on the full labels; the interim "x45 too flat" of E150 was measured
on random-only binaries where the true spread is small and the correction error was not, and
is withdrawn as a comparison.
Prediction 3 confirmed: a strain cut is required, and the tail it removes is where
bcc_binary_alloys samples the equation of state on purpose.
EXPERIMENTS.md · lines 9768–9796
E151, the cut sweep — and the gate quantity fails as a cut-selector. Diagnostic 1 at
increasing strain cuts (|correction| in meV/atom, --skip-direct):
Non-monotonic, and the tightest cut is the worst. That is not the labels; it is the metric.
Diagnostic 1 fits a linear slope of E_lattice against a_in within a composition. Under
a tight cut the surviving frames are the ones already near their own equilibrium, where
E(a) is quadratic and nearly flat and the span of a_in is narrow, so a straight line
through them measures curvature and fitting noise, not a residual volume dependence — and
the "removed %" shrinks because the before slope is small there too, not because the
correction got worse. The pre-registered gate quantity is a sound test for "did the
correction do anything" on the full set, and an unsound one for choosing where to cut. I
stated it as the decisive diagnostic; as a selector it is withdrawn.
What is robust in the table: 400 and 800 sit on a plateau at ~18, and the jump to 31 is the
800 tail — the same 571 frames diagnostic 3 identifies as where correction error enters.
Replacement, stated before it is run: within composition, regress E_lattice on the
signed input strain d = a_in - a_relaxed and report slope x median|d| — the label's
remaining dependence on how strained the input frame was, which is what the correction was
supposed to remove and which does not conflate with the physical curvature of E(a). Predicted:
monotone in the cut, under 15 meV/atom by cut 800, and the reference-gap sign split (Cr, Hf, V
fitted above raw cells) closes at the same cut.
EXPERIMENTS.md · lines 9798–9824
E151, diagnostic 1b — my replacement is falsified by the same mechanism, and the mechanism
is now identified. Residual over a typical frame, regressing the label on input strain
a_in - a_relaxed within composition:
I predicted monotone and under 15 by cut 800. It is neither. Tighter cuts are worse again,
and the arithmetic says why: at cut 100 a residual of 79 over a median strain of ~0.03 A
means a fitted slope near 2,600 meV/atom per A, which no correction error produces. What
produces it is the ~29 meV/atom ordered-versus-random spread measured in diagnostic 3 —
physics, uncorrelated with strain — divided by a strain span of a few hundredths of an
angstrom. Whenever 16-atom ordered cells share a composition key with 54-atom random cells,
any within-composition regression on a narrow span reads the configuration effect as a
strain slope. Diagnostic 1 had the same contamination and hid it under the curvature story.
The separation the diagnostics need: restrict the strain test to the random groups
(bcc_alloys, bcc_binary_alloys). At one composition, random 54-atom decorations have
nearly identical cluster vectors and therefore nearly identical energies — that is the
literature result E149 rests on — so their residual variation is strain or correction
error, with no configuration term to confuse it. The ordered cells are also the lightly
corrected ones (Fable measured -46 +/- 12 meV/atom of rattle on them), so the strain question
was always about the equation-of-state sets. Predicted, before running: on random-only groups
the residual is monotone in the cut and under 15 meV/atom by cut 400.
EXPERIMENTS.md · lines 9826–9859
E151, diagnostic 1b on random groups only — falsified a third time, and the reason is
structural.
Restricting to random groups removes the absurd slopes — 79 becomes 21 at the best cut — so
the mechanism named above was right. But "monotone and under 15 by 400" is wrong: 400 is a
minimum at 20.9, and tightening past it does not lower the residual, it removes the test
set, because the strained equation-of-state frames are both what tests the correction and
what the cut discards. A cut on |correction| cannot be selected by this diagnostic, on
principle, not just on these numbers.
What is measured and stands: at the plateau, the correction leaves ~21 meV/atom of
strain-correlated error on a typical random EOS frame — MACE's relative accuracy over a
few-hundred-meV bridge is 5-8%, and 5-8% of that bridge is the size of the ordering signal.
By the same slope an ordered cell at its typical ~0.03 A of input strain carries ~6 meV/atom.
The contamination is concentrated in the frames that carry the least ordering information.
Reframed, with a prediction before the measurement. Cut on the input strain
|a_in - a_relaxed| itself, not on the correction, and judge the cut by the cleanest noise
estimate available: the within-composition sd among random decorations, which by the
cluster-vector argument have almost no physical spread, so their post-correction spread is
correction error and nothing else. Predicted: that sd is under 10 meV/atom at
|strain| <= 0.05 A and rises monotonically with the cut; at least 80% of the
bcc_alloys_ordered cells survive a 0.05 A cut (they were rattled, not strained); and the
random EOS frames beyond 0.10 A are where the sd exceeds 20. Falsified if the sd among random
decorations is already above 15 at 0.05 A — then the residual is not strain-correlated at all
and the correction is noisy even where it has little to do, which would send this back to the
label pipeline rather than to a cut.
EXPERIMENTS.md · lines 9861–9905
E151, diagnostic 2 under the cut — the sign split does not close, and my prediction that
it would is falsified. Reference gaps (fitted minus raw direct, meV/atom):
el     none    cut 400   cut 800
Cr     -223    -200      -195
Hf     -137    -106       -97
Mo     +207    +194      +193
Nb      +98     +28       +40
Ta      +71     +22       +27
Ti       +4     +12        +6
V       -53     -52       -42
W       +165    +116      +129
sd       139     115       115
Nb, Ta, W and Ti tighten with the cut, as a strained-tail leak would. Cr, Mo, Hf and V do
not move. So the tail was part of it and the rest is something a strain cut cannot reach,
and the elements name it:
Hf, and to a lesser extent Ti and Zr: physics. Group-IV bcc is dynamically unstable at
0 K. A rattled bcc Hf cell is not a noisy version of the ideal one, it is partway down a real
instability, so its raw energy sits below the ideal-lattice reference. A fitted reference
above a raw cell is exactly what should happen for Hf. This is the blind spot already
recorded against every bcc cluster expansion in this project, appearing in the references.
Cr, and probably V: the convention sits at MACE's volume, not DFT's.E_lattice is the
energy of the ideal configuration at the volume MACE relaxes it to. Where MACE's
equation-of-state minimum is displaced from PBE's, every frame containing that element
carries an offset proportional to its fraction — a composition-dependent shift, which is
precisely the linear-in-composition term the regression puts into the reference. RHEA is
non-spin-polarised and MACE-MPA-0 was trained on a Materials Project chromium that is not,
so Cr is the element where the two equilibria are least likely to agree.
Mo +194 and W +193 persist too and are not group IV; they are the largest positive gaps,
consistent with the same volume mismatch in the other direction.
What this does and does not cost. A per-element volume offset is absorbed exactly by a
cluster expansion's singlet terms and cancels in any energy difference at fixed composition.
It does not touch ordering energies, which is what the ladder's bottom rung is for. It does
shift formation energies and therefore the hull, so the hull must not be built from these
labels without the offset measured.
Pre-registered test of the Cr mechanism. For pure-element frames the label file records
a_in (RHEA's cell) and a_relaxed (MACE's minimum). Take, per element, the a_in of the
lowest-energy raw cubic cell as the PBE equilibrium and compare it with MACE's a_relaxed
for the same frames. Predicted: Cr differs by more than 0.03 A; Mo, Nb, Ta, W within
0.01 A; Hf and Ti undefined in the sense that their bcc minimum is not a minimum. If Cr
agrees with DFT to 0.01 A the mechanism is wrong and the Cr offset is unexplained.
EXPERIMENTS.md · lines 9907–9929
E151 result — the cut, chosen by the noise among random decorations.
|strain| <=   kept   random  ordered (kept%)   testable comps   sd among random decorations   max |corr|
0.02 A         399     215      184   ( 7%)          1                 0.4                        170
0.05 A       2,068     835    1,233   (46%)          1                 0.4                        198
0.10 A       4,326   1,708    2,618   (97%)         14                12.4                        327
0.20 A       5,399   2,711    2,688  (100%)        132                47.1                      1,162
all          6,438   3,750    2,688  (100%)        703                54.2                      4,537
Monotone: confirmed. The spread among random decorations of one composition — which have
almost no physical spread, so this is correction error — rises 0.4 → 12.4 → 47 → 54 with the
strain admitted. "At least 80% of ordered cells survive 0.05 A": falsified, 46%. The
ordered cells are more strained relative to MACE's minimum than "rattled, not strained"
implied. "Under 10 at 0.05 A": unassessable, one testable composition.
The cut is 0.10 A. It keeps 4,326 frames including 97% of the ordered cells, caps the
correction at 327 meV/atom, and leaves a label noise floor of 12.4 meV/atom against the
29 meV/atom ordering spread of diagnostic 3 — about 2:1 per structure, which a fit over
thousands of structures averages down and which is stated here so nobody reads the training
loss as the label accuracy. Past 0.10 A the error is ~50 meV/atom and would swamp the signal;
the frames it removes are the equation-of-state sets, not the ordered ones.
Eleven frames fall out of "all" (6,438 of 6,449): their strain is non-finite. Checked below.
EXPERIMENTS.md · lines 9931–9964
E151, three closures.
The eleven non-finite frames are the +6.5 eV tail. Three 128-atom ordered cells and eight
54-atom random ones have a_relaxed = NaN and corrections of -4.2 to -6.6 eV/atom — MACE
returned non-finite energies somewhere in their volume scans (input lattice constants 3.06 to
3.76 A, the expanded end), the parabola fit propagated it, and E_lattice = E_DFT - (-6 eV)
became the +6,534 meV/atom maximum E150's prediction 1 was falsified on. So that tail was
eleven broken frames, not a strained population; the strain cut and an isfinite guard in
the reference pass both exclude them. E150 prediction 1 stands falsified on the sd (259)
but its "max +6,534" was a bug, not a distribution.
The Cr-volume test cannot run as pre-registered. The label pass covered the three alloy
groups; the pure-element cubic cells for Cr, Mo, Nb, Ta, V and W sit in pure_elem_lowE,
which it skipped. Only Hf (12 frames) and Ti (3) had bcc cells inside bcc_binary_alloys:
Hf: MACE minimum 3.527 A vs DFT's lowest raw cell at 3.600, -0.073 A — outside 0.03,
but Hf was the element I said would be undefined, since its bcc "minimum" is the
instability; Ti: -0.005 A, inside 0.01. The test's actual target, Cr, is pending a label
pass over pure_elem_lowE (launched now, ~105 cubic cells).
The P1 training file.runs/rhea_labels_formation_strain0.10.jsonl: 4,326 frames,
formation energies mean 0.0, sd 63.4, range -305 to +189 meV/atom, references
Cr -9.243, Hf -12.406, Mo -11.045, Nb -10.185, Ta -11.766, Ti -7.703, V -8.895, W -12.950,
Zr -8.183 eV/atom (within 5 meV of the cut-400/800 values, as the non-tail mechanism
requires).
P2 baseline, predicted before it runs. Scoring ce_12element — the current bottom rung,
fitted to MACE labels on random cells, never shown an ordered cell — on these labels, within
composition where every offset cancels: (1) its within-composition rank correlation with DFT
is below 0.3; (2) its |dE| scale is under a third of DFT's (DFT's is ~29 meV/atom
here) — the "too flat" reading of E150's interim, now on labels that can support it;
(3) MACE-MPA-0 on the same structures ranks better than the expansion (rho above 0.5),
since it at least saw ordered intermetallics in training. Falsified if the expansion's
rho/comp exceeds 0.6, which would mean it resolves ordering it was never trained on and the
case for replacing it weakens to a cost argument.
EXPERIMENTS.md · lines 9966–10011
E151, P2 baseline — my prediction is falsified on every count, and the falsification is
the most important number of the day.ce_12element and MACE-MPA-0 scored within
composition on the 0.10 A labels (212 compositions with >= 3 configurations, 2,292 structures):
model           MAE dE   rho pooled   rho/comp   |dE| DFT   |dE| model
ce_12element     14.5      0.847        0.651      28.8       28.1
MACE-MPA-0       12.0      0.895        0.671      28.8       28.9
label noise floor (E151)                                       12.4
(1) "rho/comp below 0.3": 0.651. (2) "|dE| under a third of DFT's": 28.1 against 28.8
— the scale is right to 2%. (3) "MACE ranks better": true by 0.02, which is nothing. The
falsification condition I set — rho/comp above 0.6 — is met. The current bottom rung
resolves ordering energies it was never shown, at the right magnitude, and its 14.5 meV/atom
error is at the 12.4 meV/atom noise floor of the labels themselves. On this set it cannot
be told apart from a perfect model, and neither can MACE.
Withdrawn:E150's interim "the expansion is 45x too flat" and E151's "17x" — both were
measured on random-only binaries where the DFT spread was correction error, not physics. The
expansion's spread matches DFT's once the labels are clean. The case for the eCE is not
within-distribution ordering accuracy; it is extrapolation into withheld chemistry and cost
per element, which is what the paper claims and what P2's MoNbTaW/MoNbTaVW holdout tests.
Cr-volume test — falsified, informatively. MACE's bcc minimum sits above DFT's lowest raw
cell for all six elements, not Cr alone: Cr +0.057, Mo +0.035, Nb +0.030, Ta +0.050,
V +0.041, W +0.037 A. A uniform ~1% offset is worth tens of meV and has one sign; it cannot
make Cr -200 against Mo +190.
The two-route reference comparison, redone in one convention — fitted references at the
0.10 A cut against the lowest corrected pure cell from the pure_elem_lowE pass:
Cr +265 Mo -129 V +91 Nb +27 Ta +28 W -25 meV/atom (fitted minus pure)
Still scattered, and pure Cr cells needed only 63 meV/atom of correction, so this is not the
correction either. The mechanism, and the one I recorded in memory and on the plan page
is withdrawn: a composition-linear regression over alloys does not recover elemental
energies. Its intercepts are "elemental energy plus the mean mixing slope along that
element's direction", and with five pure-Cr frames against thousands of Cr-containing alloys
the Cr column is set by the alloys. That is a property of regression intercepts, not of
MACE's volume. The right references are the corrected pure cells where they exist (six
elements) with only Hf, Ti and Zr fitted — a follow-up for the hull, since a per-element
constant is absorbed exactly by any expansion's point terms and does not touch ordering.
P1 died on my bug.train_ece.py wrote each m x m x m supercell's fractional coordinates
into a 1 x 1 x 1 cell — 54 atoms in a 3.29 A cube — and pyeCE rejected all 4,326 structures
as "lattice deformation too large". ideal_frac_of returns m; emit discarded it. Fixed;
relaunched to a fresh directory.
EXPERIMENTS.md · lines 10584–10597
E151 follow-up — references from corrected pure cells, done.--pure-references holds
Cr, Mo, Nb, Ta, V, W at the lowest corrected pure bcc cell from the pure_elem_lowE pass
and regresses only Hf, Ti, Zr on the remainder:
Cr -9.5084   Mo -10.9154   Nb -10.2122   Ta -11.7940   V -8.9864   W -12.9257   (measured)
Hf -12.3721  Ti -7.6645    Zr -8.1505                                            (fitted)

formation energy, 4,326 frames at the 0.10 A cut:  mean +17.2  sd 83.1  min -270  max +324 meV/atom
The mean is no longer zero by construction — a set of real bcc formation energies has a
mean, and this one is positive because the equation-of-state sets sample unfavourable
mixtures on purpose. This file, rhea_labels_formation_strain0.10_pureref.jsonl, is the one
a hull is built from. Ordering energies are unchanged by a per-element shift; the eCE
training file need not be rebuilt for P1, only for any formation-energy use.
Related entries
E150 — E149 found the smaller of the two defects. The labels were the bigger one.
E78 — First principles agrees with the potential about the ranking, to 1 and 4 meV/atom
E149 — The eCE was being trained on the half of RHEA that cannot see ordering